Alpha Discovery · Problem Solver
#10 How to Interpret PE/PB, Growth, and Analyst Signals
· 7 min read
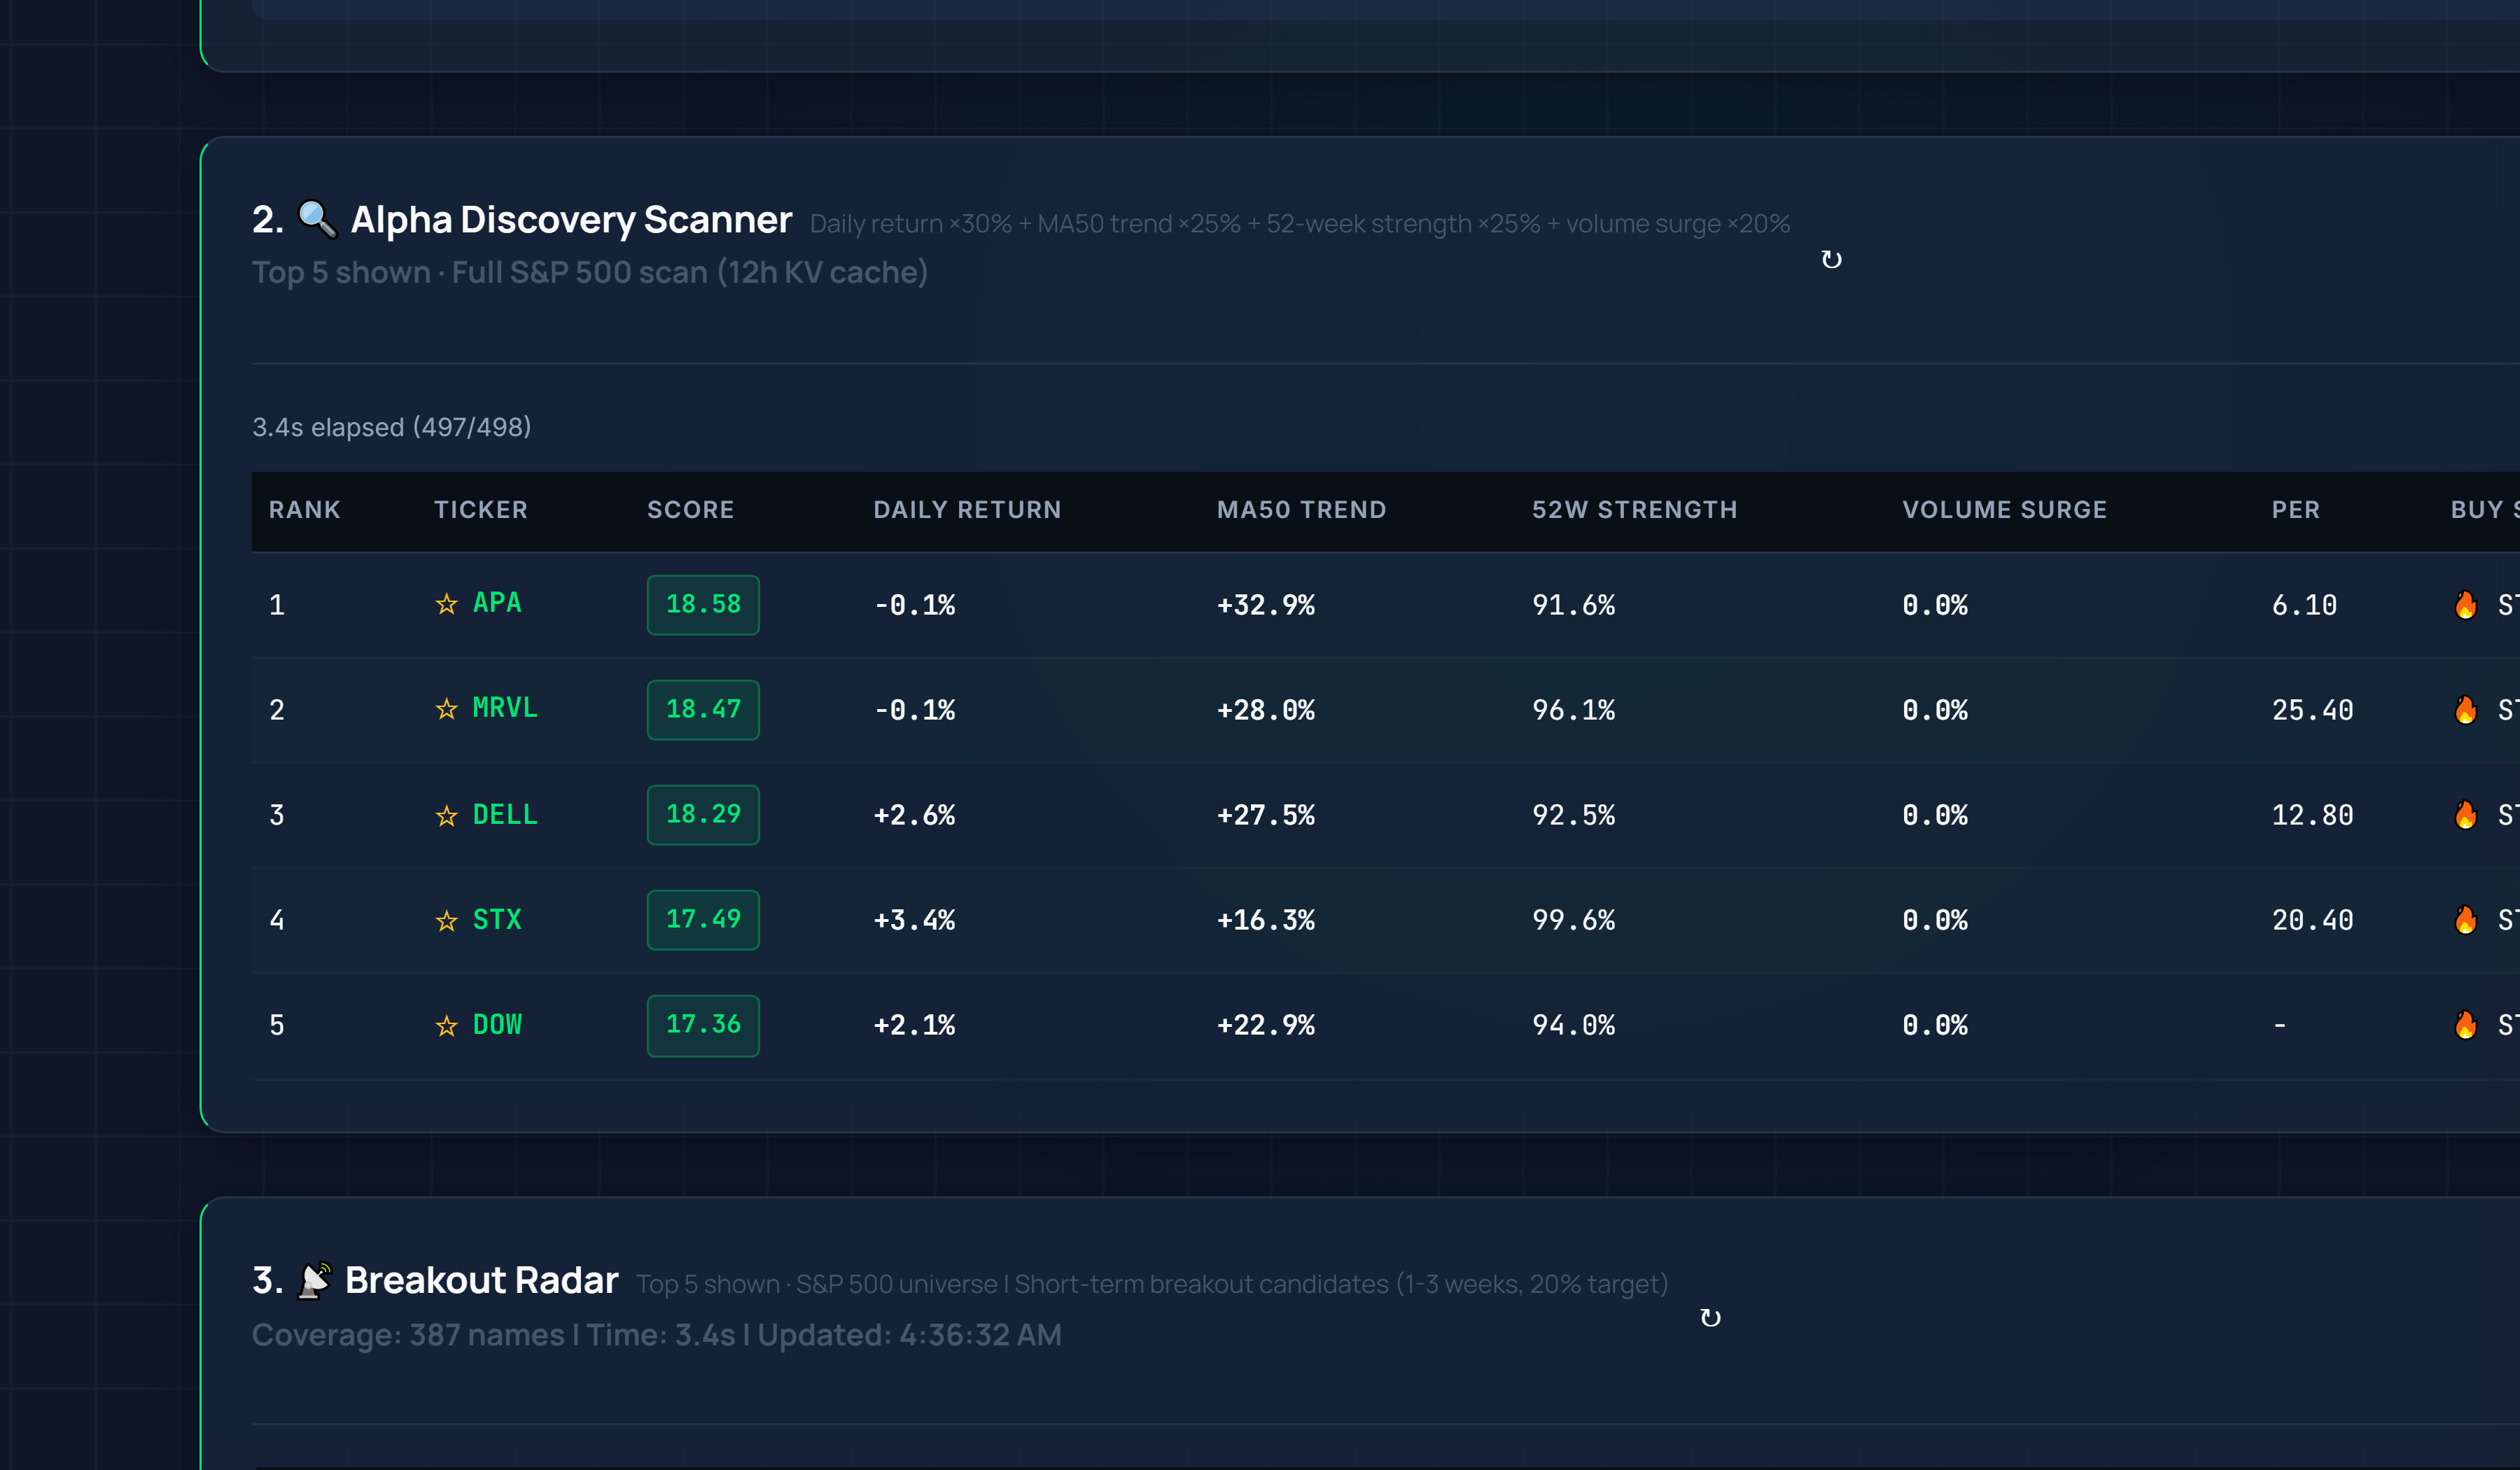
Live Alpha Discovery Scanner capture showing PE/PB ratios, growth quality, and analyst signals.
📍 Home › ANALYSIS_1 › Alpha Discovery Scanner
0) Where to Find This Widget
From the main mobile dashboard (12 tiles), open ANALYSIS_1. Use Single-Stock Deep Dive and the Alpha Discovery Scanner table on that page to read PE/PB, growth, and analyst signals together.
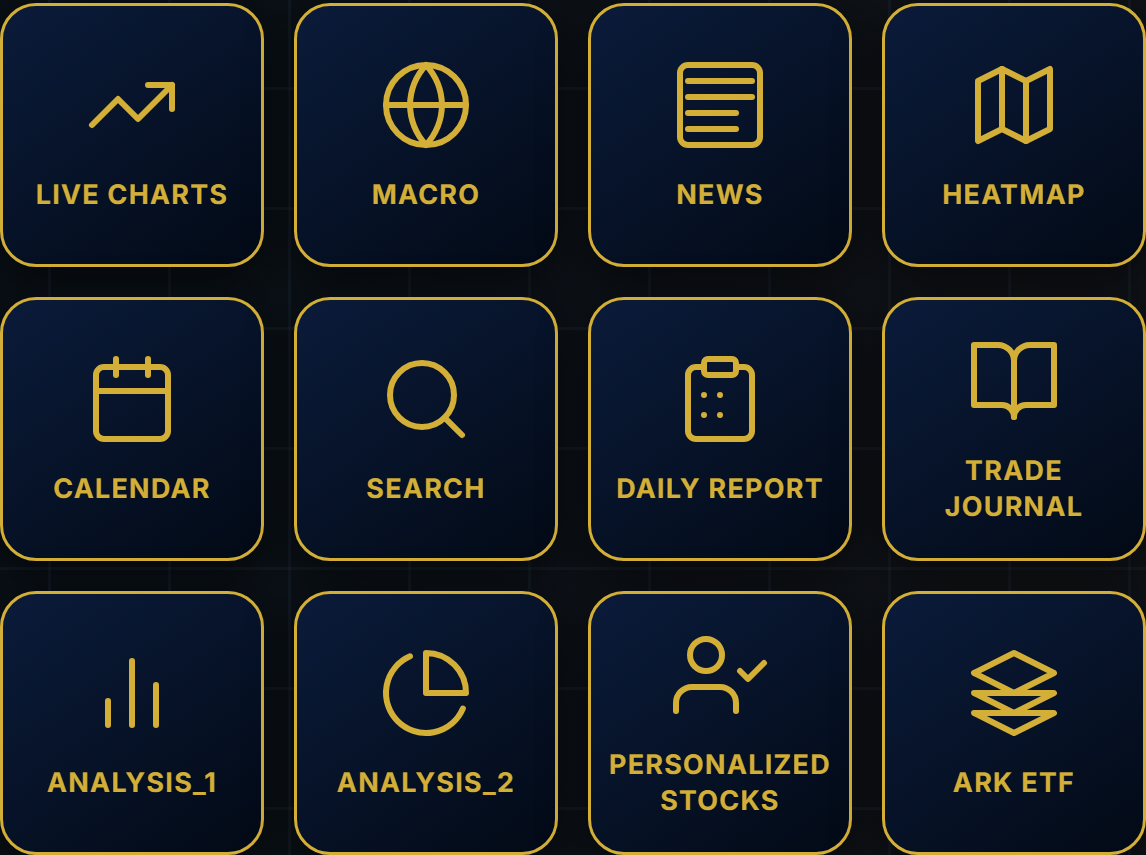
Live capture of Dashboard in Inveflo.
1) TL;DR
This framework explains how to read PE/PB, growth, and analyst signals in one screen. It matters because single-metric decisions often lead to false entries. Use it when a stock looks attractive but conviction is unclear.
2) Hook (Pain-Driven)
Most investors misread stocks because they look at PE or price alone. Cheap can stay weak, and expensive can keep winning when growth and sentiment support it.
3) Problem
Without a unified reading order, PE/PB, growth, and analyst signals conflict and produce hesitation. That uncertainty leads to late entries or missed setups.
4) Solution (Widget Introduction)
On the ANALYSIS_1 page, use Single-Stock Deep Dive. Read PE/PB, growth, and sentiment together, then validate context with Composite Market Score.
5) Logic Breakdown (Formula + Thresholds)
- High Conviction: InterpretationScore ≥ 78 and Growth Quality ≥ 70 and Analyst Signal ≥ 70
- Watch: InterpretationScore 65-77 with mixed factors (one signal weak)
- Avoid: InterpretationScore < 65 or Composite Market Score < 45
6) Practical Use (IF X → THEN Y)
- If PE/PB is fair and growth quality is strong ≥70, then promote to active candidate.
- If valuation looks cheap but growth deteriorates <50, then keep on watch list or skip entirely.
- If analyst signal weakens for 2 sessions while price rises, then trim 25% and tighten stops immediately.
Should I buy now? Buy only when valuation, growth, and analyst signals align ≥65 score minimum. Is this signal strong? Strong means score consistency across all three factors; weakness in any one = Watch. What should I do next? Keep the name active on watchlist, monitor for 2-3 days, wait for signal reconfirmation.
7) Common Mistakes
- Using PE alone as a buy trigger without checking growth or sentiment alignment
- Ignoring growth quality when comparing valuation (cheap + decelerating growth = trap)
- Reading analyst signal without market regime context (strong signal in poor regime = risky)
This is not a standalone buy signal and requires trend confirmation plus Composite Market Score ≥50 backdrop.
Frequently Asked Questions
What is a fair PE ratio for a growth stock?
Fair PE depends on growth rate: rough rule is PE should equal growth rate (PEG ratio = PE/growth = 1). A stock with 20% annual EPS growth should trade at ~20x PE. Below 1.0 is attractive; above 1.5 is expensive. Always compare peer PE ranges within sector; absolute numbers are less useful than relative comparisons.
How do I use PB (Price-to-Book) along with PE?
PB ratio measures market value relative to accounting value. Low PB (<1.0) with high growth suggests value opportunity; high PB (>3.0) with declining growth is risky. Use PB to confirm PE signal: if PE is fair but PB is rising rapidly, it signals market overestimating returns. Pair both metrics together; never use either in isolation.
What does analyst signal strength mean?
Analyst Signal (0-100) aggregates rating consensus, target price upside, and estimate revision momentum. Score above 70 = strong bullish consensus. Score 50-70 = mixed; wait for clarity. Score below 50 = weak or bearish. High score + rising growth + improving valuation = buy candidate. Watch for signal decline 2+ days as early exit warning.
When should I doubt this framework?
InterpretationScore fails when: (1) Composite Market Score is below 45 (regime overrules all signals), (2) earnings surprise is imminent (forward estimates unreliable), (3) insider selling accelerates (contradicts analyst bullishness). When in doubt, default to regime check first, then reduce position size by 50%.
Related Posts
CTA: Open Scanner and Find Opportunities
Scan the full S&P 500, compare quality and signal scores, and build your watch list before market open.