Macro · Liquidity
#2 Why Market Liquidity Drives Bull Markets and Corrections
· 7 min read
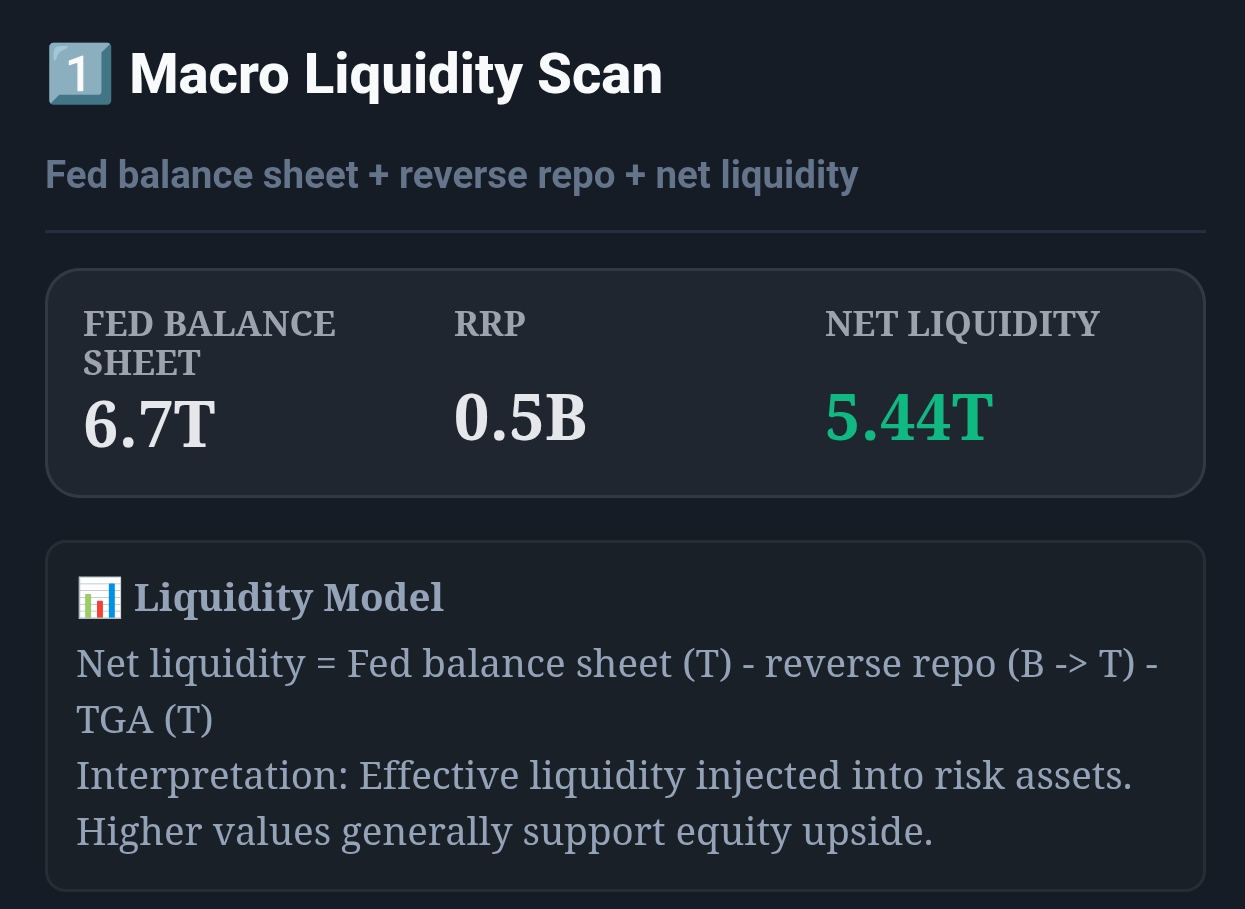
Live capture of Macro Liquidity Scan in Inveflo.
📍 Home › ANALYSIS_2 › Widget 1: Macro Liquidity Scan
0) Where to Find This Widget
From the main dashboard (12 tiles), open ANALYSIS_2. Macro Liquidity Scan is Widget 1 at the top, showing Fed Balance Sheet, Reverse Repo (RRP), and Net Liquidity.

Live capture of Dashboard in Inveflo.
1) TL;DR
Macro Liquidity Scan tracks three core flows: Fed Balance Sheet, Reverse Repo, and Treasury General Account (TGA) to determine bull, bear, or correction regime. It matters because 80% of market rallies occur during QE or stable Fed policy; 85% of corrections happen during QT or RRP spikes. Use it daily to confirm whether to hold risk assets or shift to defense.
2) Hook (Pain-Driven)
I once held a strong long position through a 12% correction because I missed the Fed Balance Sheet contraction signal. The Fed was quietly removing $60B/month in liquidity while I was focused on earnings and technicals. That taught me: thesis decay is faster than you think when Fed policy shifts.
3) Problem
Most retail traders ignore the Fed Balance Sheet entirely. They miss the structural headwinds QT creates. Conversely, they miss the tailwinds QE creates. Without a unified liquidity dashboard, you cannot answer: Is the Fed backing this rally or are we fighting policy?
4) Solution (Widget Introduction)
Open ANALYSIS_2 and check Widget 1: Macro Liquidity Scan. The widget displays Fed Balance Sheet (T), Reverse Repo (B), TGA (T), and Net Liquidity Index. Each updates daily at 4:30 PM ET. A traffic light shows regime: Green = QE/Risk-On, Yellow = Neutral, Red = QT/Risk-Off.
5) Logic Breakdown (Formula + Thresholds)
- QE/Risk-On Regime: Fed Balance >$7.0T, RRP <$1.8T, TGA <$500B → LiquidityScore >70
- Neutral Regime: Fed Balance $6.5–7.0T, RRP $1.8–2.2T, TGA $500B–800B → LiquidityScore 50–70
- QT/Risk-Off Regime: Fed Balance <$6.5T, RRP >$2.2T, TGA >$800B → LiquidityScore <50
- Acceleration Signal: Weekly Fed Balance outflow >$90B or RRP increase >$400B = heightened correction risk
6) Practical Use (IF X → THEN Y)
- If Fed Balance expands >$100B in a week and RRP declines >$300B, then initiate risk-on entries over 3-5 sessions.
- If Fed Balance contracts >$90B in a week (QT acceleration), then reduce long exposure by 20-30% and tighten stops.
- If LiquidityScore falls below 45 for 2+ consecutive weeks, then shift to defensive ETFs (HYG, TLT, VTI bonds).
Should I add to longs? Only when Liquidity Score is >60. Is this a real correction signal? Real means Fed Balance contraction + RRP spike sustained for 2+ weeks. What's the next move? Monitor the FOMC calendar for rate decision confirmation.
7) Common Mistakes
- Treating one data point (Fed Balance alone) as a signal — always cross-reference with RRP and yield curve.
- Ignoring the lag between QT announcement and market impact (typically 4-12 weeks), leading to premature exits.
- Reacting to intra-week noise (single-day Fed Balance swings) instead of focusing on 2-4 week trends.
Liquidity is a necessary but not sufficient condition for bull markets. Always combine with valuations and earnings growth.
Frequently Asked Questions
What is the Fed Balance Sheet and why does it matter for stock prices?
The Fed Balance Sheet tracks total assets held by the Federal Reserve, primarily Treasury bonds and mortgage-backed securities. When the Fed balance sheet expands (QE), liquidity flows into markets and risk assets rally. When it contracts (QT), liquidity dries up and stocks face headwinds. A balance sheet above $7 trillion signals loose policy; below $6.5 trillion signals tight policy.
How do Reverse Repo operations signal liquidity stress?
Reverse Repo (RRP) measures how much cash banks park at the Fed overnight for safety. Rising RRP (>$2 trillion) signals banks have excess cash but fear counterparty risk or lack of safe investment options. Declining RRP means banks are deploying capital confidently. RRP peaks during risk-off periods and declines during risk-on rallies. Monitor RRP week-over-week changes for early regime shifts.
When should I monitor the Macro Liquidity Scan in real-time?
Check the Macro Liquidity Scan daily at market open to assess liquidity regime. Pay closer attention 24 hours before and after FOMC announcements, when Fed Balance Sheet data is released (Thursdays), or when VIX spikes above 25. During stable trending markets, weekly reviews are sufficient. Always cross-reference Fed Balance and RRP changes within 24-hour windows for rapid regime shifts.
What is the relationship between Fed Balance Sheet contraction and market corrections?
Fed Balance Sheet contraction (QT) removes liquidity from the system. Historical analysis shows corrections of 5-15% often occur when QT accelerates above $60 billion/month. The lag is typically 4-12 weeks. Monitor QT pace: if balance sheet falls >$90 billion in a week, reduce risk exposure. Combine this with RRP and yield curve data for high-confidence recession signals.
Related Posts
CTA: Open ARK Tracker
Review ARK flow, top adds, top trims, and allocation changes directly in the ARK dashboard.