This manual covers the full V3 probability engine: market regime analysis + recommendation scoring + Top Picks + sector leader workflow.
0) Quick Onboarding (Real Screenshots)
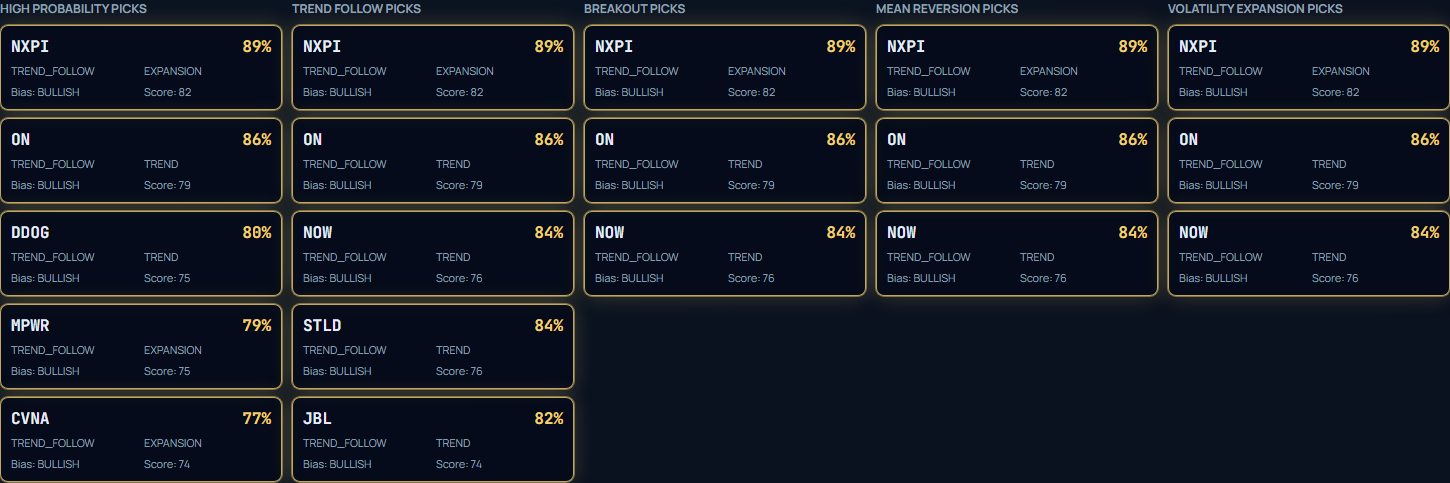
Use this sequence for first-time onboarding: summary → top picks → matrix → table → detail panel.
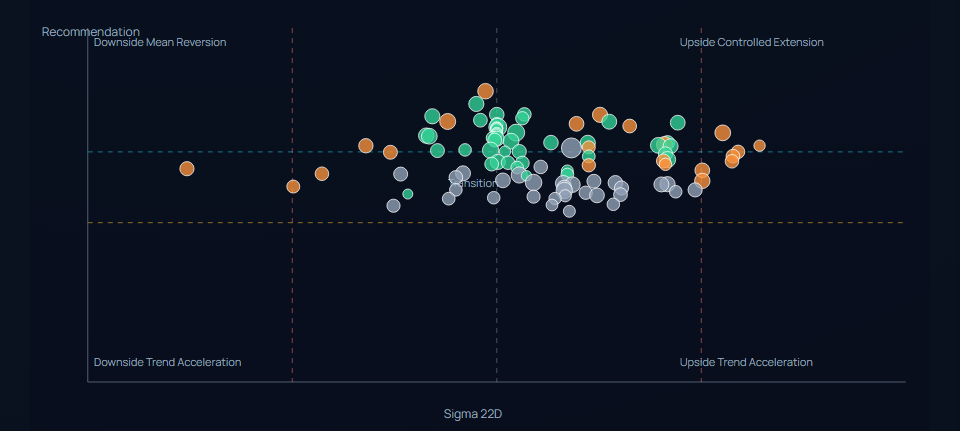
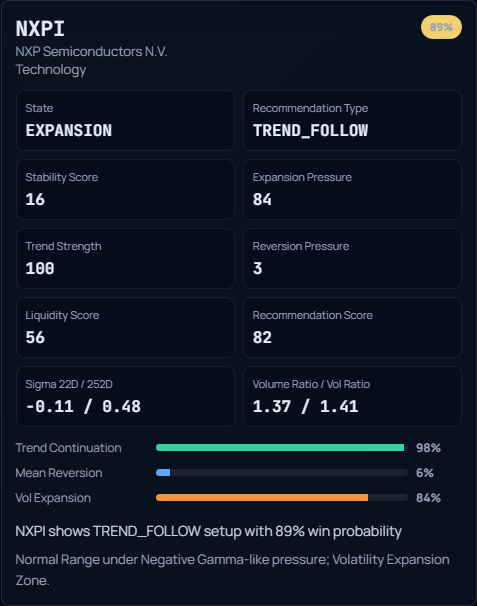
Step 1 · Summary Cards Check Market Pressure, High Probability count, Dominant Regime, and Trend vs Reversion ratio first.Step 2 · Top Picks Scan 70%+ highlighted setups and compare recommendation types before symbol-level deep dive.Step 3 · Matrix Read regime clustering by sigma axis and recommendation score, then click an outlier symbol.Step 4 · Detail Panel Validate state, recommendation type, win probability, and the three probability bars.
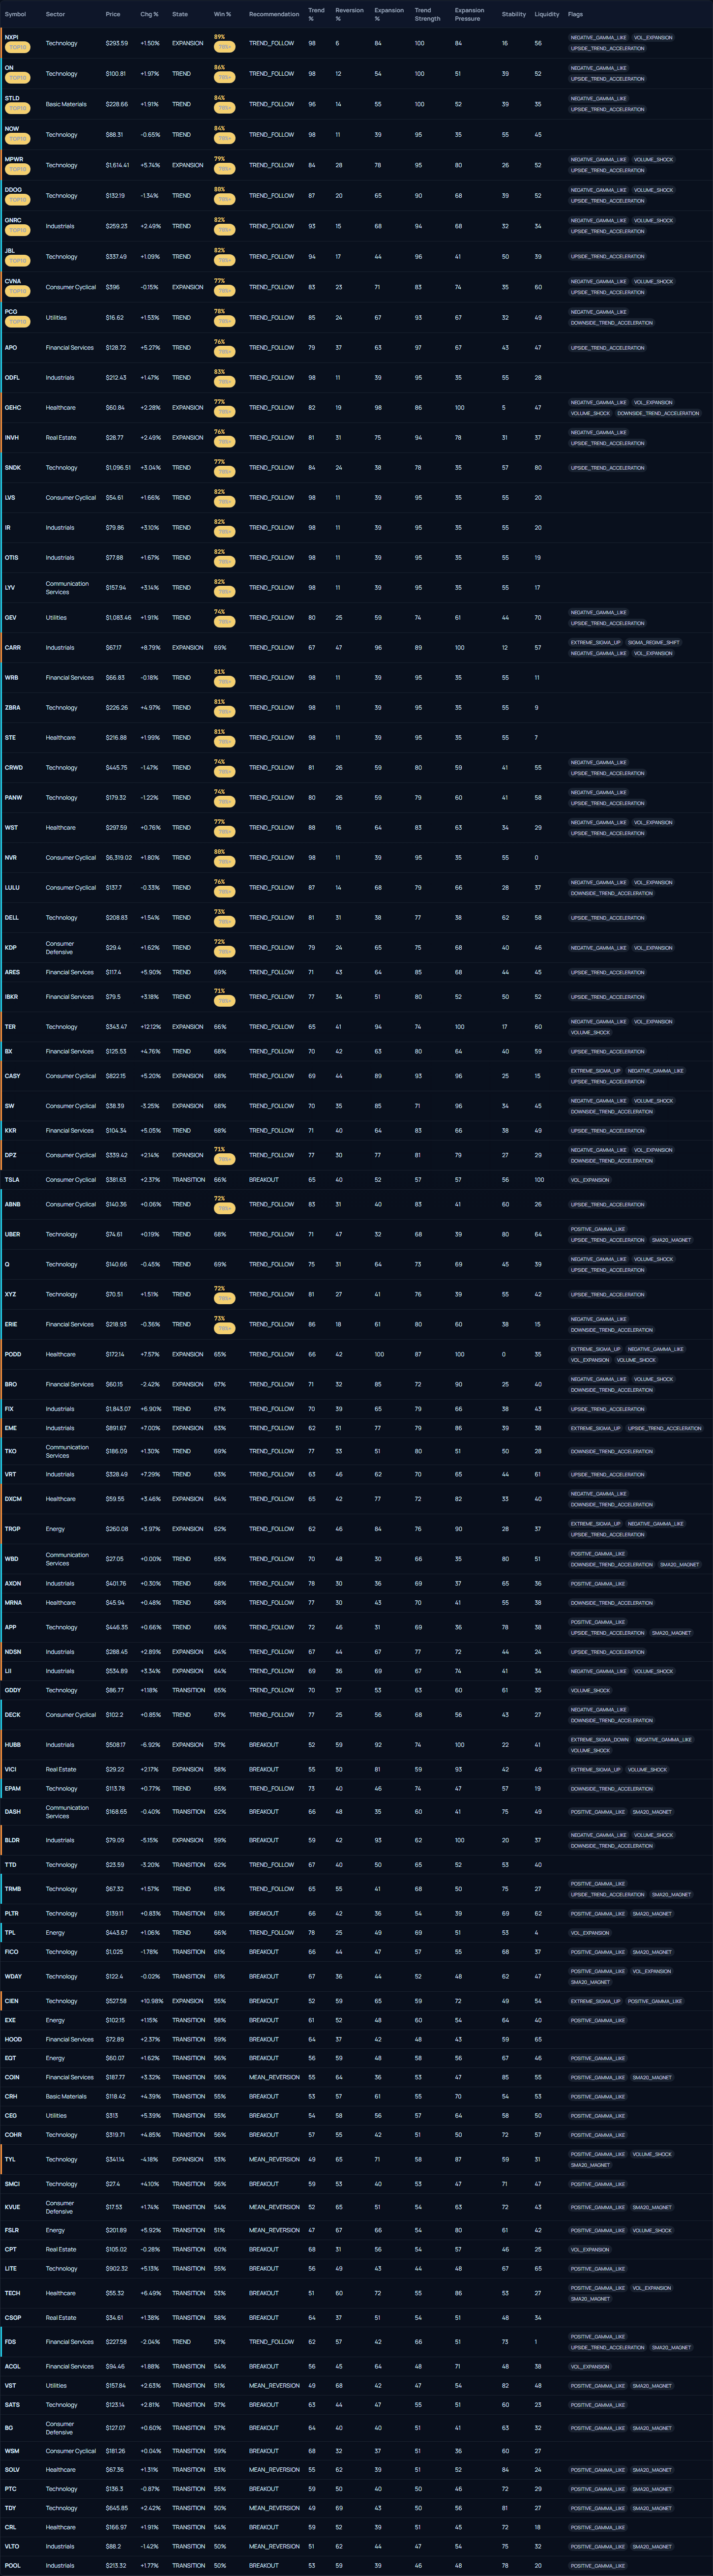
Step 5 · Table Execution View Sort by Win %, Recommendation Score, Trend Strength, and use filters for final actionable shortlist.
1) What V3 Adds
V3 keeps all V2 regime signals and adds an institutional recommendation layer.
New V3 fields: liquidityScore, recommendationScore, winProbability, recommendationType, highProbability, rank.
This model does not use options open interest, dealer positioning, or real GEX.
2) V3 Summary Cards
Field
Meaning
How To Read
Market Pressure
0-100 aggregate pressure index.
Higher = broader expansion/instability risk.
High Probability Setups
Count of symbols passing the 70%+ gate.
Operational shortlist for tighter focus.
Dominant Regime
Most common state among loaded symbols.
Quick context for current market structure.
Trend vs Reversion
Average trend continuation vs mean reversion ratio.
Shows whether continuation or reversion dominates.
3) Scatter Chart Meaning (V3 Matrix)
V3 uses: X = Sigma 22D, Y = Recommendation Score. Bubble size tracks liquidity context. Color tracks state (Trend/Expansion/Compression/Exhaustion/Transition).
4) V3 Filter Bar
Control
Purpose
Example
Symbols (optional)
Use specific symbols instead of the default S&P500 universe.
TREND_FOLLOW: trendContinuation > 60 and trendStrength > 60
MEAN_REVERSION: meanReversion > 60
BREAKOUT: volExpansion > 60 and sigma near 0 to 1
VOLATILITY_EXPANSION: volExpansion > 70 and COMPRESSION state
Risk exclusions can still downgrade/remove candidates from Top Picks.
8) Top Picks, Sector Leaders, and Detail Banner
Top Picks are generated from S&P500 universe by winProbability ranking.
Category constraints: each recommendation type aims to keep at least 3 candidates when possible.
Sector Leaders select one best recommendationScore per sector, with winProbability >= 65.
When you click a sector card, the detail panel shows a sector summary banner: Avg Win %, Avg Recommendation, High Probability count, Dominant State.
9) Why You Might Not See Every Symbol
The API can load up to 500 symbols for S&P500 mode. The table/chart then shows top symbols by market cap according to your selected row limit (100 / 200 / 300 / all) after filters are applied.
Also, V3 risk controls can exclude low-liquidity / low-cap / extreme exhaustion names from recommendation focus lists.
10) API Endpoints (V3)
GET /analysis/sigma-gamma-v3: full matrix + recommendation engine fields + topPicks + sectorLeaders.
GET /analysis/top-picks: topPicks payload only.
GET /analysis/sigma-gamma and /analysis/sigma-gamma-v2 remain available for compatibility.
11) Update and Cache Policy
Auto update is aligned with server cache policy:
- U.S. market hours (ET 09:30 to 16:00): every 1 hour
- After hours: every 6 hours
Top Picks cache key: sg:top-picks (same intraday/after-hours TTL).
History snapshot key: sg:history:{date} for backtest-ready tracking.
This reduces API load while keeping the dashboard operationally stable across the full site.
12) Important Limitation
Synthetic Gamma-like Pressure is a behavior proxy based on price, volume, volatility, and trend structure. It is not real options gamma or GEX.
Labels like “win probability” are model-derived probabilities, not guarantees of future outcomes.
This manual and widget are for market context and risk regime interpretation only, not financial advice.