Alpha Discovery · Breakout Detection
#25 How to Detect Early Breakout Stocks Before They Explode
04/15/2026 · 5 min read
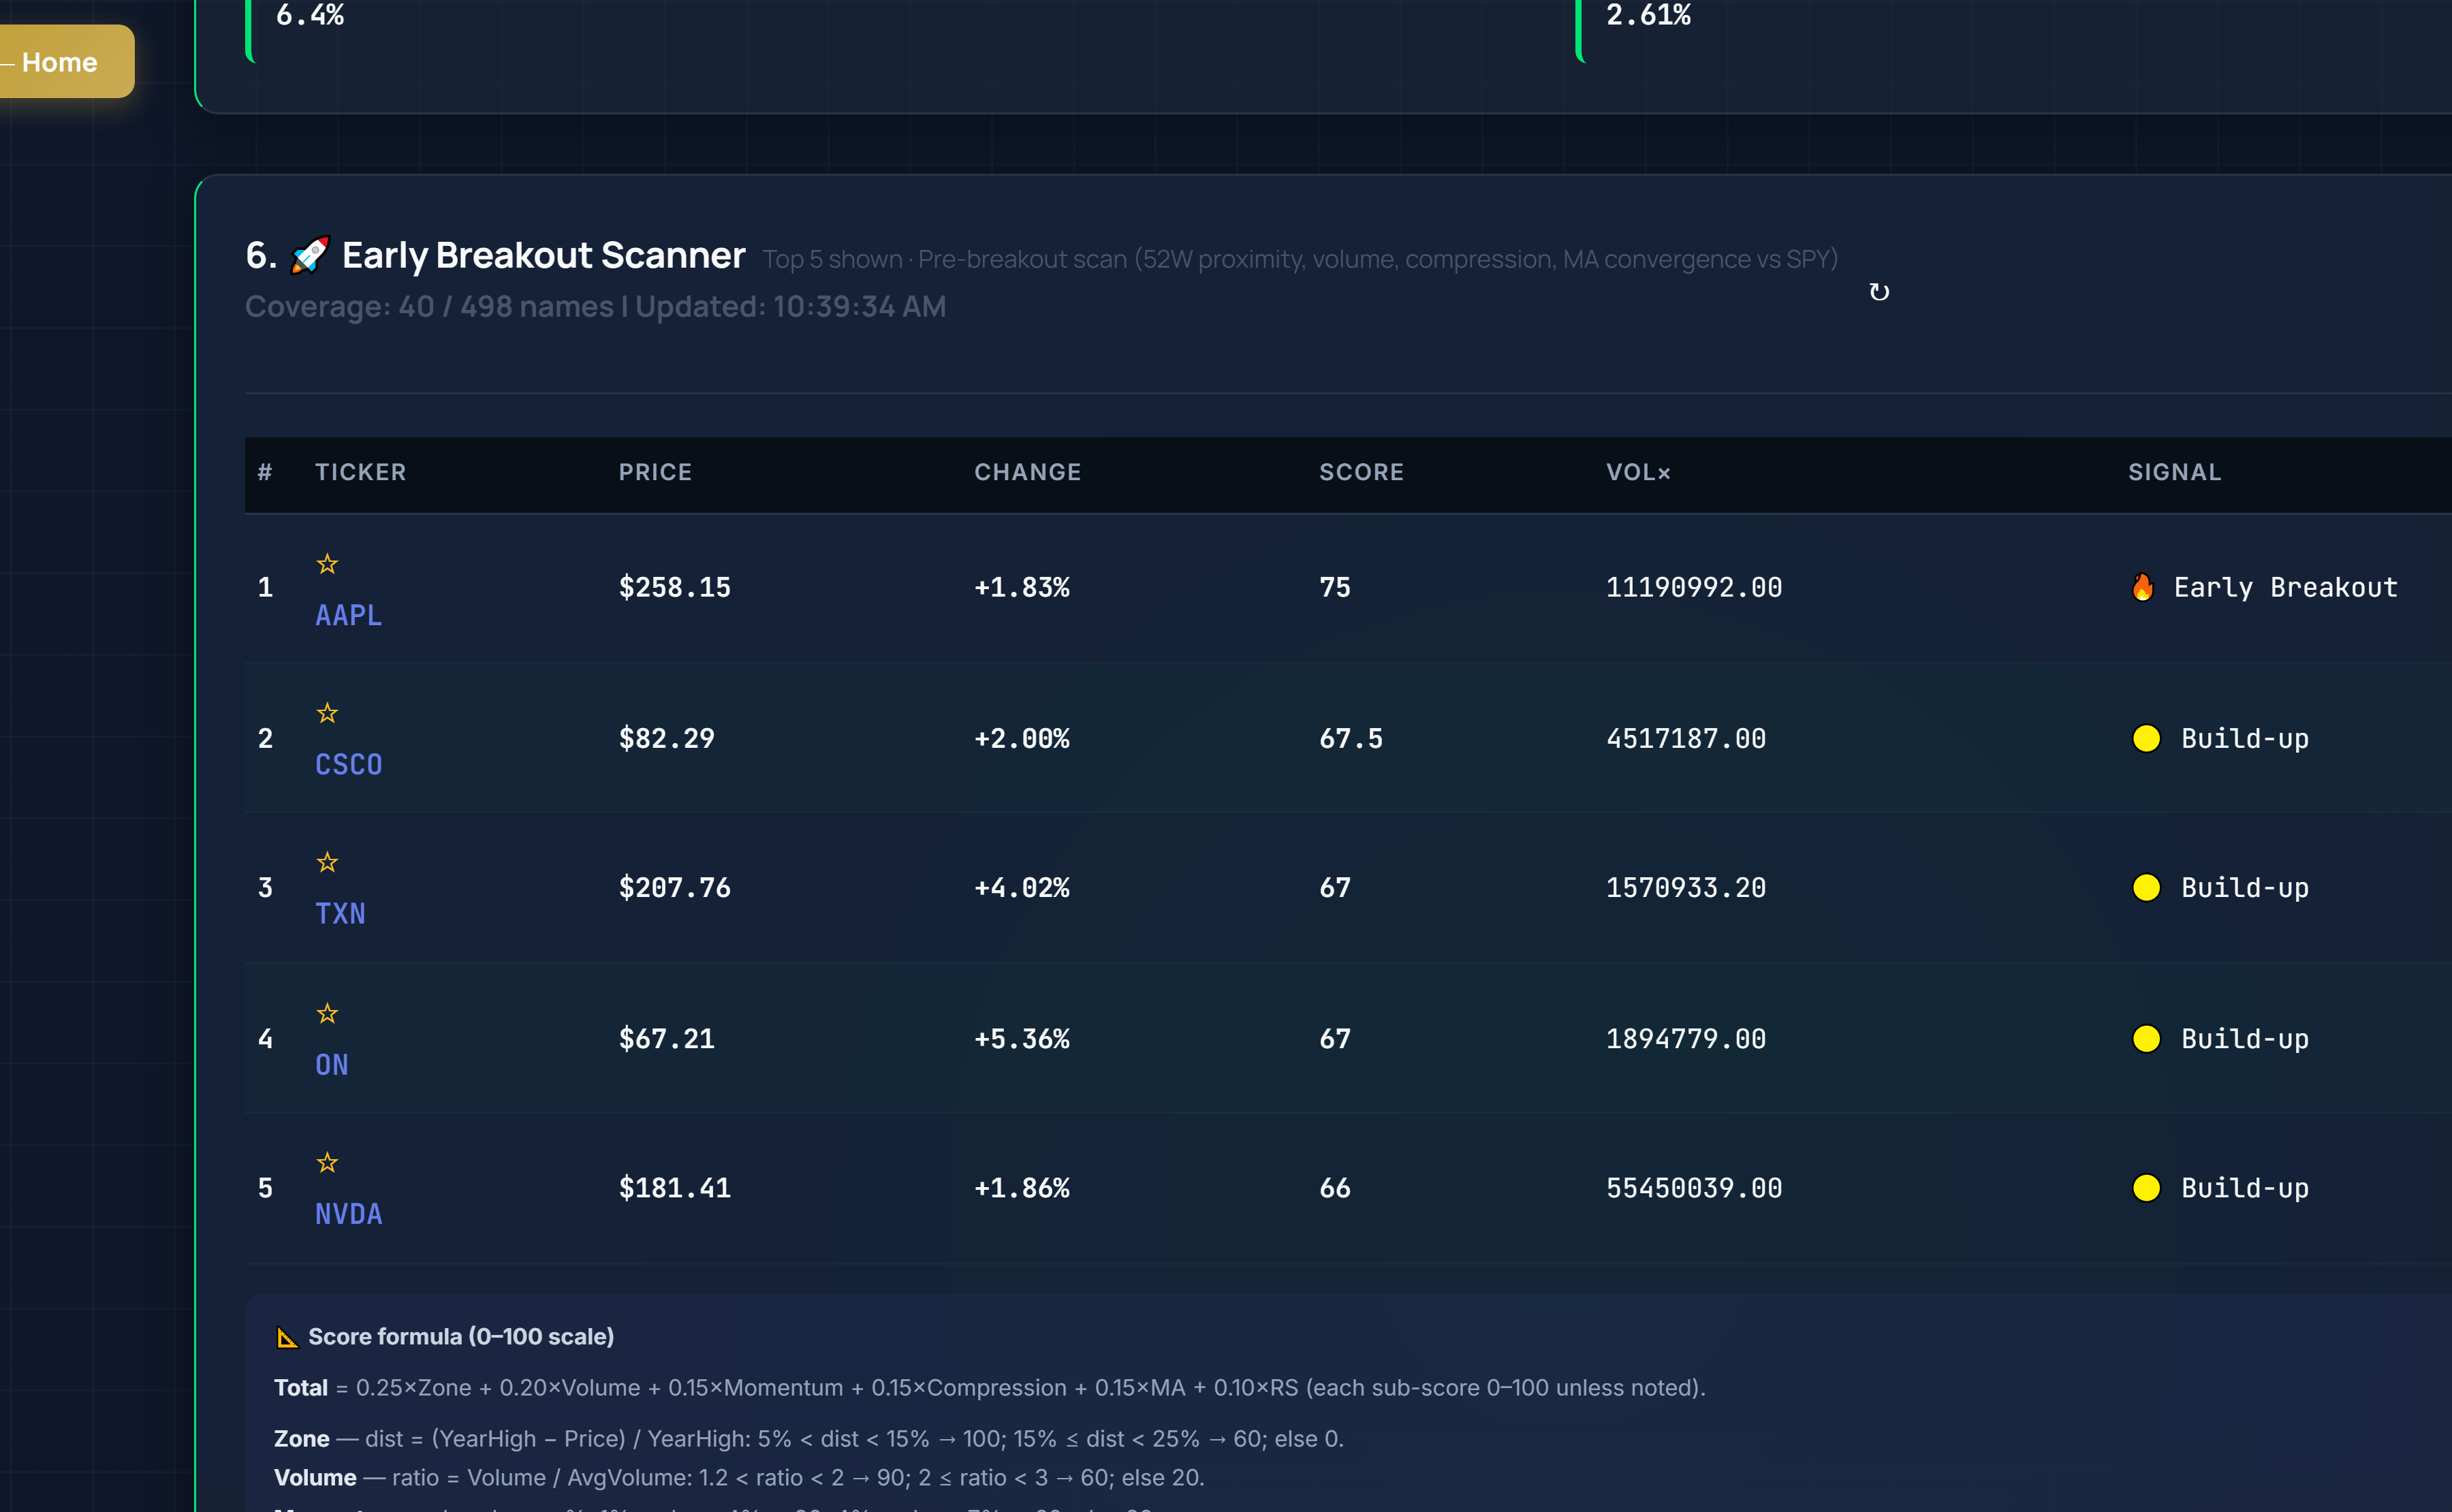
Live capture of Early Breakout Scanner in Inveflo.
📍 Home › ANALYSIS_1 › Early Breakout Scanner
0) Where to Find This Widget
From ANALYSIS_1, scroll to Early Breakout Scanner. This widget shows stocks breaking multi-week resistance in real-time, updated intraday.

Live capture of Dashboard in Inveflo.
1) TL;DR
Early Breakout Scanner identifies stocks breaking 4-week+ resistance at the exact moment it happens. Catch the first wave before the crowd. Entry at inception = maximum reward potential with defined risk (below breakout level).
2) Hook (Pain-Driven)
I've watched breakouts run 15%+ and couldn't find entry because I was looking at the chart AFTER the move. This scanner shows inception point so you catch the first wave, not the seventh.
3) Problem
Waiting for chart confirmation costs you 5-8% of the move. Most traders see breakout AFTER it's already moved. You need real-time detection at inception to get best risk/reward.
4) Solution (Widget Introduction)
Open Early Breakout Scanner. It shows stocks that just broke 4-week, 8-week, or 52-week resistance. Sort by CSS score, enter the highest-conviction setups at inception.
5) Logic Breakdown (Formula + Thresholds)
- Inception = 0-2% above resistance: Maximum reward potential. Best risk/reward entry window.
- Early = 2-5% above: Confirmation emerging. Still good entry.
- Late = 5%+ above: Move already visible. Lower probability catch-up.
- Volume Spike > 1.5x avg: Confirms breakout legitimacy.
6) Practical Use (IF X → THEN Y)
- If stock appears in Early Breakout Scanner + CSS ≥ 75, then enter immediately with 3-5% size. Inception point = best risk/reward.
- If stock 1-2% above resistance, then enter with full position. Still in inception zone.
- If stock 5%+ above, then size down to 2% or wait for pullback to break level.
7) Common Mistakes
- Wait for 3-bar confirmation. By then, 5-10% is already gone.
- Enter without volume spike. Volume confirms breakout legitimacy.
- Chase breakouts 10%+ above level. Late entry = low probability.
Frequently Asked Questions
How do I know if a breakout is real vs a false break that will reverse?
Volume is the key confirmator. True breakout = volume spike >1.5x average on breakout bar. False break = normal or declining volume. Also check intraday chart: true break holds above resistance for 15+ min. False break = closes below resistance same day. CSS score >75 is secondary confirmation.
What's the maximum distance above breakout level before entry becomes too late?
Inception = 0-2% above (best risk/reward, enter immediately). Early = 2-5% above (still good entry). Late = 5-10% above (consider sizing down to 1-2% or wait for pullback). Beyond 10% = chase territory; skip unless pullback confirms secondary support level.
Should I size bigger at inception point since risk/reward is best?
Only if CSS ≥75. Standard rule: inception + CSS ≥75 + volume confirmed = 3-5% position size (full size). Inception + CSS 60-74 = 2-3% (half size). Inception + CSS <60 or no volume = 1% or skip. Don't override CSS signal with timing advantage alone.
How long does the inception entry window stay open?
Inception window (0-2%) typically lasts 5-30 minutes depending on volume. Once price moves >2%, you're in early zone (less optimal risk/reward). By 5%+, most inception advantage is gone. If you miss inception, wait for intraday pullback to near breakout level for second-chance entry with reduced size.
Related Posts
- #6 Fake vs Real Breakouts: Three Checkpoints to Validate Signals Breakout Radar
- #16 Tight Stops on Early Breakouts: Dynamic Stop Loss Strategy Breakout Radar
- #8 Breakout Radar: Short-Swing Template and Trade Exits Breakout Radar
CTA: Open Scanner and Find Opportunities
Scan the full S&P 500, compare quality and signal scores, and build your watch list before market open.