Alpha Discovery · Breakout Radar
#15 How to Evaluate Breakout Signal Quality With Breakout Radar
04/10/2026 · 7 min read
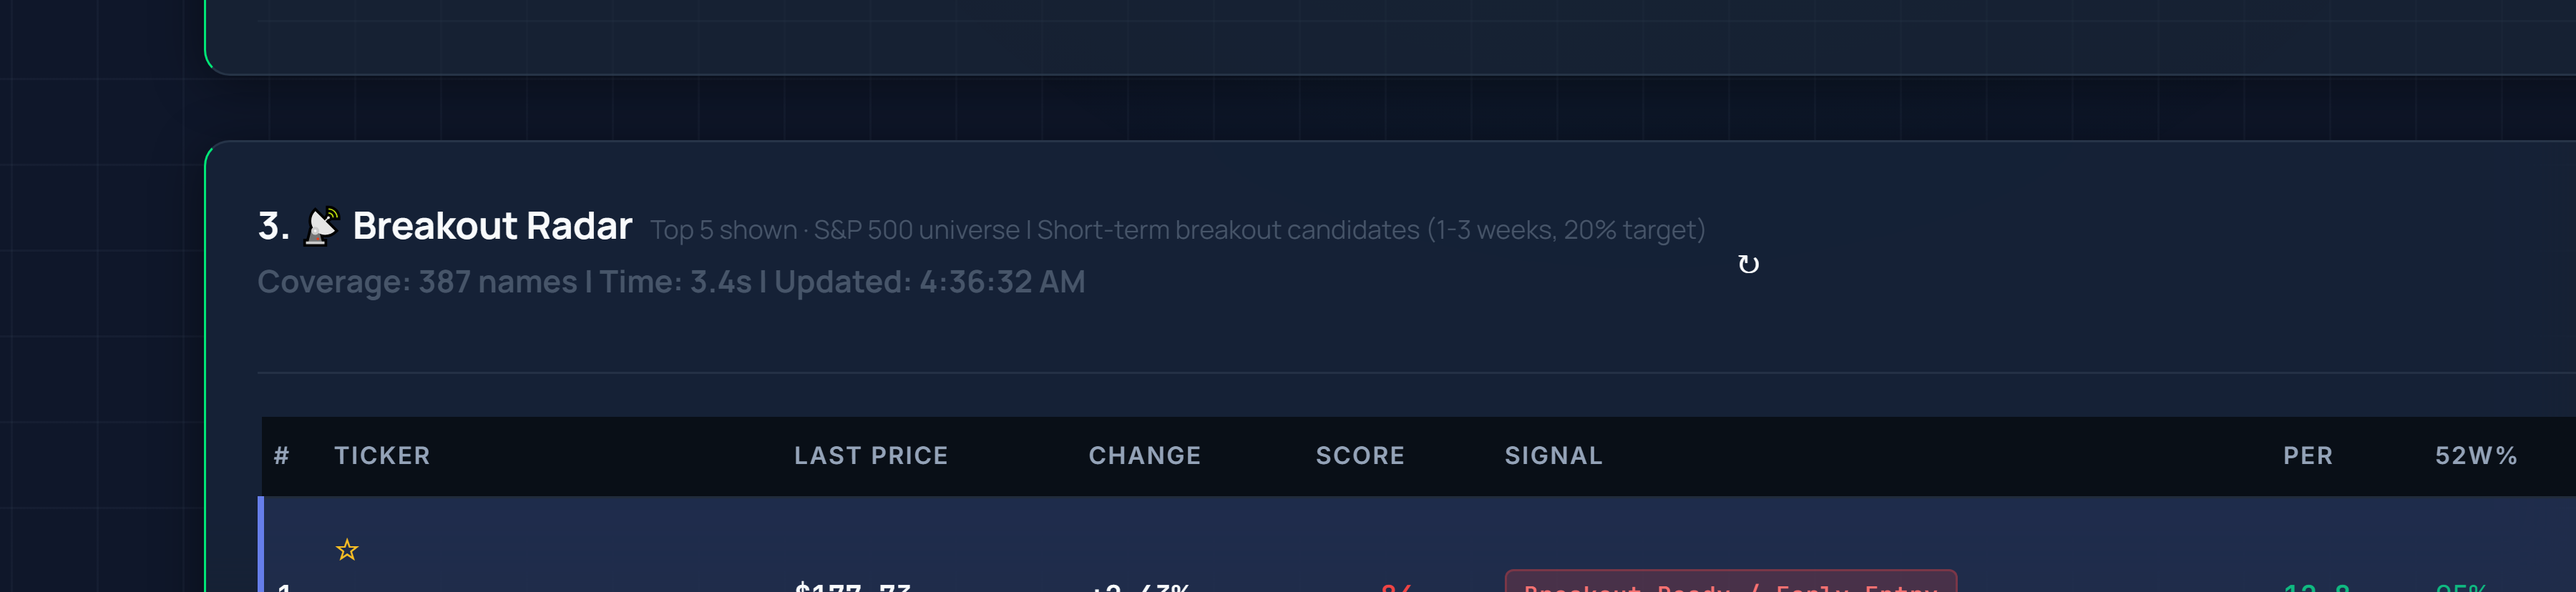
Live capture: Breakout Radar signal-quality panel on Inveflo.
📍 Home › ANALYSIS_1 › Breakout Radar
0) Where to Find This Widget
From the 12-tile dashboard, open ANALYSIS_1. Scroll to the Breakout Radar widget on that page.
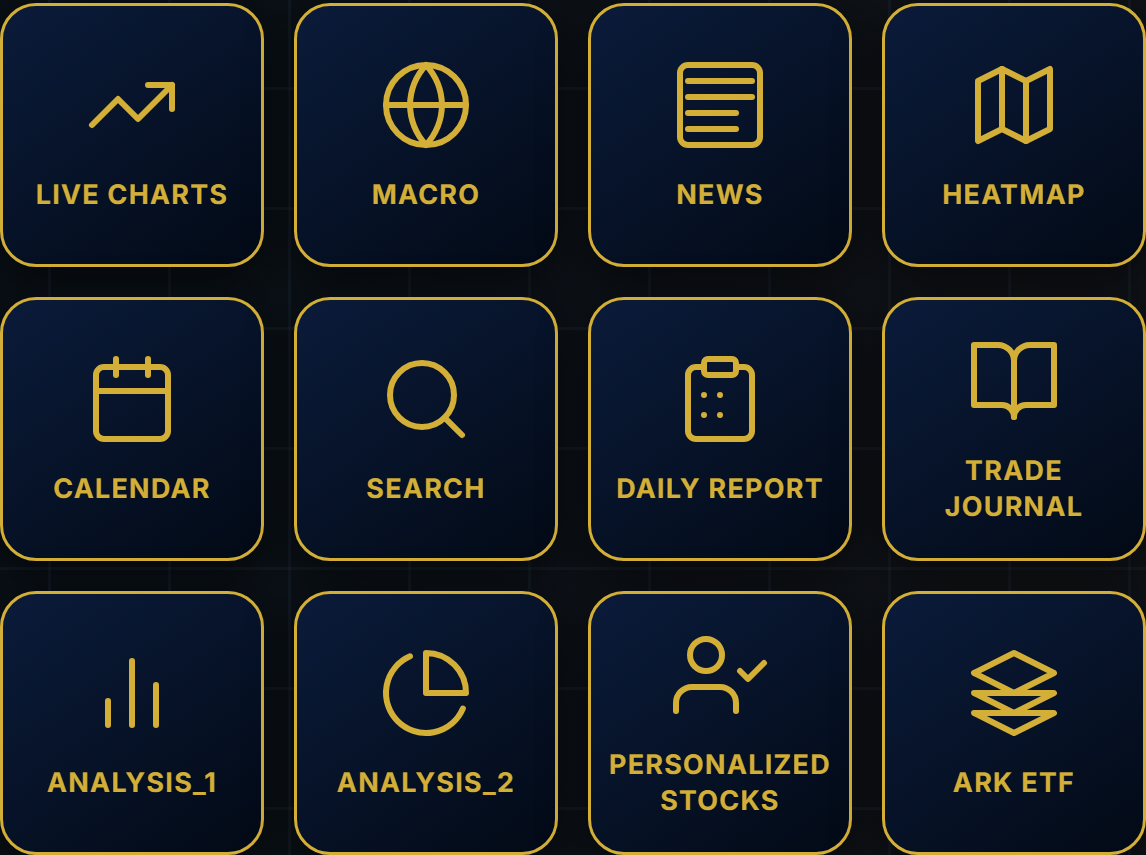
Live capture of Dashboard in Inveflo.
1) TL;DR
Breakout Radar helps you grade signal quality, not just detect movement. It matters because weak breakouts fail fast and trap entries. Use it before every breakout trade decision.
Key Takeaways
- Quality = Composite Score: SignalQuality combines structure (35%), volume participation (30%), relative strength (20%), and catalyst alignment (15%)—not price action alone.
- Threshold Bands Matter: High ≥80, Medium 65-79, Low <65. Only trade high-quality breakouts; skip low-quality regardless of rank.
- Participation Confirms Conviction: Volume Surge Ratio >1.5 shows strong institutional interest; <1.5 indicates retail-driven noise likely to fade.
- Not Standalone: Breakout Radar requires trend confirmation, regime checks, and position sizing—use within your broader trading framework.
2) Hook (Pain-Driven)
Most breakout losses come from confusing motion with quality. Price can pop, but without participation and structure, follow-through is low.
3) Problem
Raw breakouts are noisy. You need a quality model that confirms whether the move is likely to continue or fade.
4) Solution (Widget Introduction)
Use Breakout Radar labels and score decomposition to inspect structure, volume participation, and catalyst support in one view.
5) Logic Breakdown (Formula + Thresholds)
- High quality: SignalQuality ≥ 80 and Volume Surge Ratio > 1.5
- Medium quality: 65-79 with at most one weak component
- Low quality: < 65 or multiple weak components
6) Practical Use (IF X → THEN Y)
- If quality is high and regime is supportive, then stage entry.
- If quality is medium, then wait for one more confirmation session.
- If quality is low, then skip regardless of rank.
Should I buy now? Buy only high-quality breakouts. Is this signal strong? Strong means structure plus participation. What should I do next? Confirm quality band, then execute or skip.
7) Common Mistakes
- Buying every breakout label the same way
- Ignoring participation weakness in early spikes
- Skipping regime checks when volatility is high
This is not a standalone buy signal and requires trend confirmation and position sizing rules.
Frequently Asked Questions
How do I differentiate between high-quality and low-quality breakouts?
Use the SignalQuality score which combines structure (35%), volume participation (30%), relative strength (20%), and catalyst alignment (15%). High quality = score ≥80 with volume surge >1.5. Medium quality = 65-79 with one weak component. Low quality = <65 or multiple weak components.
Should I buy every breakout that Breakout Radar labels?
No. Only trade high-quality breakouts where both signal quality ≥80 AND volume participation is strong. Medium-quality signals warrant a confirmation session before entry. Low-quality signals should be skipped regardless of their ranking.
What does 'participation weakness' mean in the context of early spikes?
Participation weakness occurs when price rises sharply but volume doesn't follow proportionally. Volume Surge Ratio <1.5 indicates early-move volume is insufficient to sustain the breakout, making it prone to reversal.
Can I rely on Breakout Radar as a standalone buy signal?
No. Breakout Radar signals require trend confirmation and position sizing rules. Use them alongside your broader trading framework—validate structure, confirm participation, check regime support, and size appropriately for risk.
Related Posts
- #5 Breakout Radar Short Swing Template — Learn how to structure short-term swing trades using Breakout Radar signals and timing.
- #6 Fake vs Real Breakout Checkpoints — Distinguish genuine breakouts from false breakouts using volume and structure validation.
- #8 Top 5 Breakout Picks CSS Selection — Filter and rank breakout opportunities by custom CSS metrics and signal strength.
CTA: See Live Breakout Signals
CTA: Open Scanner and Find Opportunities
Scan the full S&P 500, compare quality and signal scores, and build your watch list before market open.