Macro · Liquidity
#45 What Reverse Repo Tells Investors About Market Liquidity
· 7 min read
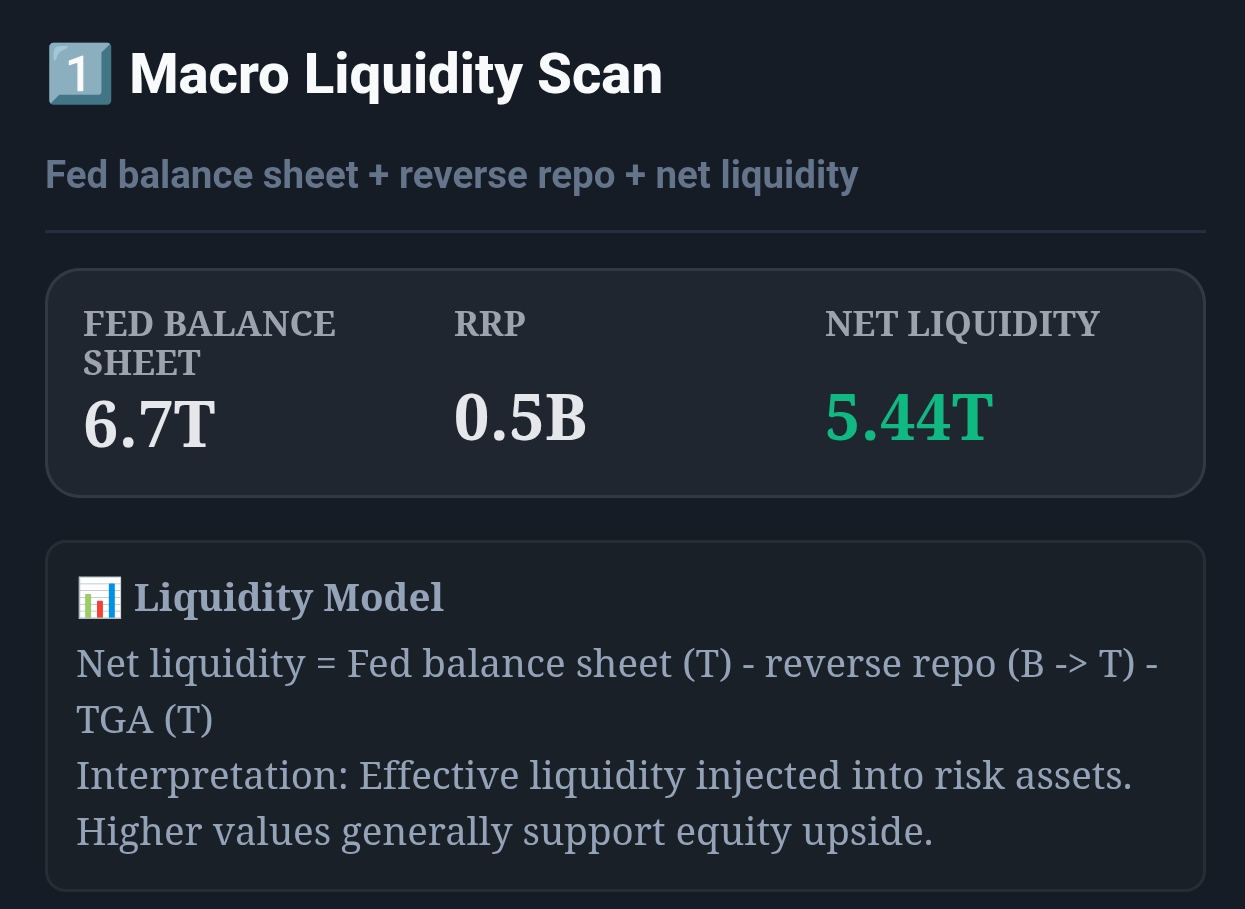
Live capture of Macro Liquidity Scan in Inveflo.
📍 Home › ANALYSIS_2 › Widget 1: Macro Liquidity Scan
0) Where to Find This Widget
From the main dashboard (12 tiles), open ANALYSIS_2. Widget 1: Macro Liquidity Scan shows RRP, TGA, Fed Balance Sheet, and the calculated Net Liquidity in real time.

Live capture of Dashboard in Inveflo.
1) TL;DR
Reverse repo (RRP) is one piece of the Federal Reserve's balance sheet. Net Liquidity = Fed Balance − TGA − RRP tells you how much cash is sloshing through the banking system. When RRP balloons, banks are parking cash at the Fed instead of deploying it — a defensive signal. When RRP falls, banks get aggressive.
2) Hook (Pain-Driven)
In mid-2023, I watched RRP explode from $800B to $2.5T without understanding what it meant. My models treated it as noise. Meanwhile, the market had already started pricing in tighter liquidity. I missed three weeks of the rally by staying defensive too long. That's when I realized: RRP is the canary in the coal mine for liquidity conditions.
3) Problem
Most traders focus only on the Fed balance sheet total. But RRP hides inside that number. When the Fed pays interest on reverse repo, banks use it to park idle cash. The more RRP grows, the less liquidity is in the real economy — and the more defensive positioning makes sense. But without understanding the net effect of balance sheet, TGA, and RRP together, you're flying blind.
4) Solution (Widget Introduction)
The Macro Liquidity Scan calculates Net Liquidity in real time. Key components displayed:
- RRP Counter: Shows current reverse repo balance (in billions). Updated daily from FRED data.
- TGA Counter: Treasury General Account balance. When the government pulls money out of the Fed, it shows as TGA withdrawal.
- Fed Balance: Total Fed balance sheet (in trillions).
- Net Liquidity Score: A calculated index that folds all three together with historical norms. Color-coded: Green = risk-on, Yellow = neutral, Red = risk-off.
5) Logic Breakdown (Formula + Thresholds)
- Fed Balance: Total assets on the Fed's balance sheet (includes Treasury holdings, MBS, discount window loans, etc.).
- TGA: Money the U.S. Treasury pulled from the Fed's balance sheet and parked in its own account. When TGA rises, liquidity in the system falls.
- RRP: Cash banks are lending back to the Fed overnight for a small interest rate. High RRP = banks have excess cash they don't want to deploy.
- Net Liquidity > $5.0T: Risk-On (Green) — Banks lending aggressively. Growth, small-cap, and leverage thrive.
- Net Liquidity $4.0T–$5.0T: Neutral (Yellow) — Balanced conditions. No clear directional bias. Whipsaw risk high.
- Net Liquidity < $4.0T: Risk-Off (Red) — Banks hoarding cash. Growth stocks sell off. Bonds, gold, and defensive plays rally.
6) Practical Use (IF X → THEN Y)
- If RRP rises >$500B in one month, then reduce growth exposure (QQQ, small-cap) by 15–20%. Increase defensive (TLT, HYG). Watch for stabilization over 2–4 weeks.
- If RRP falls from $1.2T to $800B over 6 weeks, then rotate from bonds and defensive back into growth. Increase QQQ/small-cap allocation by 20%.
- If Fed Balance falls >$200B in one month AND RRP rises >$300B, then move to full defensive: 70% bonds/TLT, 20% gold, 10% QQQ. Wait for RRP to stabilize AND Fed to pause before going risk-on again.
7) Common Mistakes
- Treating RRP as a Standalone Signal: RRP is useless without context. A rising RRP in a falling Fed balance-sheet environment is more bearish than rising RRP with a stable Fed balance sheet. Always calculate the net.
- Ignoring TGA Swings: The Treasury can pull $100B–$300B from the Fed's account in a single week. This creates flash crashes in RRP and sharp liquidity squeezes. Monitor TGA closely.
- Using Point-in-Time Levels, Not Trends: A $2.5T RRP level is scary when it comes from $800B over three weeks. The same $2.5T level held flat for eight weeks is less concerning. Always use 4-week rolling averages.
- Forgetting the Rate Differential: Banks only use RRP when the overnight rate is attractive relative to alternatives. When rates invert unfavorably, RRP can collapse even if liquidity is tight.
Frequently Asked Questions
Why does the Fed offer reverse repo at all?
The Fed uses reverse repo as a tool to drain excess reserves from the banking system during tightening cycles. By paying interest on RRP, the Fed can control short-term interest rates and prevent them from falling below the Fed Funds target. It's part of the Fed's operating framework, not a sign of crisis by itself.
Can RRP ever be a bullish signal?
Not directly. High RRP always signals tighter liquidity. But a falling RRP — especially a steep drop — is highly bullish because it means banks are moving cash out of the Fed and back into the economy. That's when the 10%+ rallies tend to start.
How does RRP interact with Fed Funds rate hikes?
When the Fed raises the Reverse Repo Rate (as part of hiking the Fed Funds rate), RRP tends to rise because banks earn more interest on deposits at the Fed. This is mechanical, not necessarily bearish. The key is: are banks choosing to hold RRP because rates are attractive, or because they have nowhere else to deploy the cash? The net liquidity formula helps you distinguish.
What's the difference between Net Liquidity and the Liquidity Premium?
Net Liquidity is a measure of the cash available in the system. Liquidity Premium is the extra yield investors demand for holding less-liquid assets (like small-cap stocks or junk bonds). Net Liquidity affects the liquidity premium: when net liquidity falls, the liquidity premium widens (investors demand higher yields), which compresses valuations.
Related Posts
- #16 Macro Liquidity Scan Overview: Why Liquidity Drives Markets Macro · Liquidity
- #23 What Falling and Rising RRP Signals About the Stock Market Macro · Liquidity
- #20 QT/QE Regime Shift Mechanics: How Policy Pivots Move Markets Macro · Fed
CTA: Open ARK Tracker
Review ARK flow, top adds, top trims, and allocation changes directly in the ARK dashboard.