Macro · Liquidity
#46 What Falling and Rising RRP Signals Mean for Stocks
· 8 min read
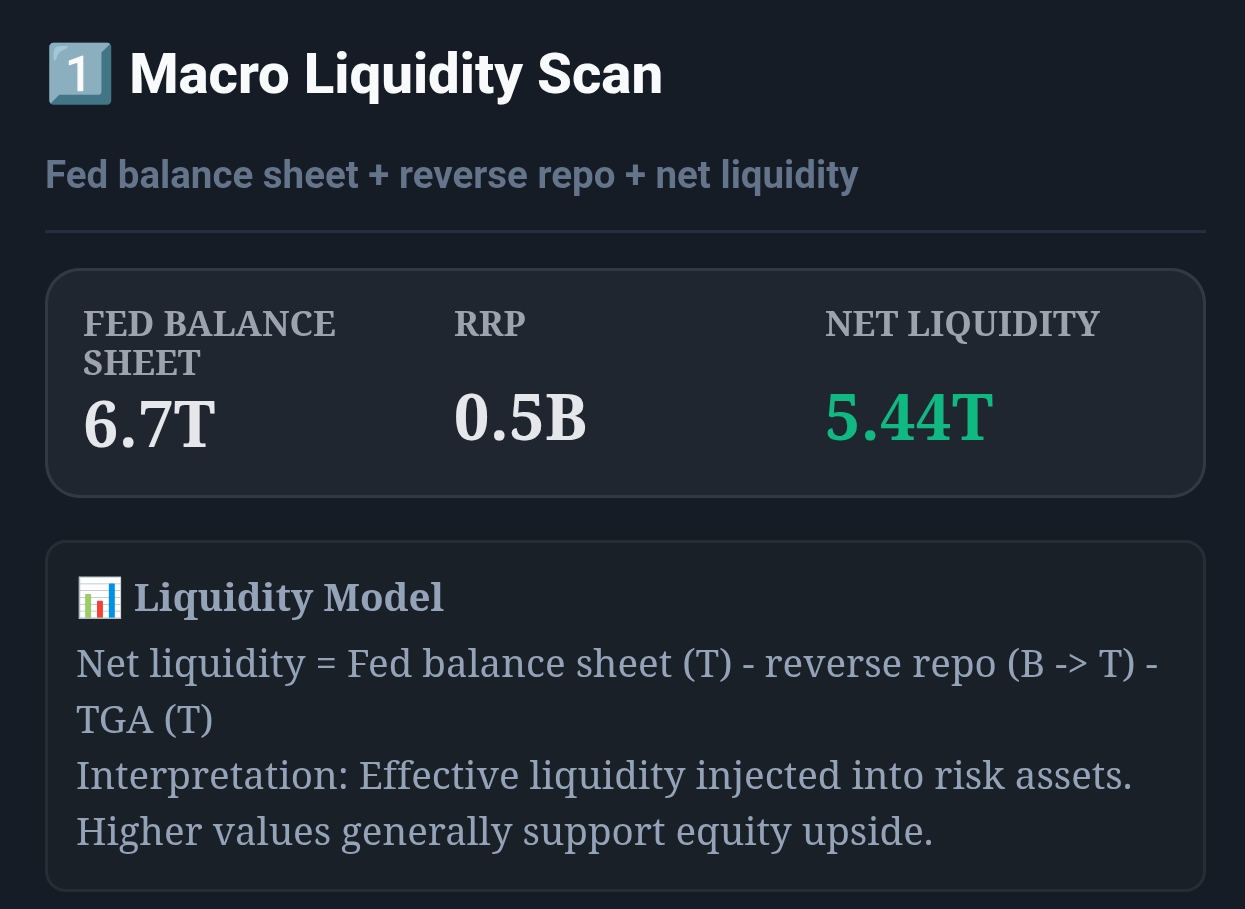
Live capture of Macro Liquidity Scan in Inveflo.
📍 Home › ANALYSIS_2 › Widget 1: Macro Liquidity Scan
0) Where to Find This Widget
From the main dashboard (12 tiles), open ANALYSIS_2. In Widget 1: Macro Liquidity Scan, watch the RRP level and its multi-week direction to infer liquidity thaw vs. freeze.

Live capture of Dashboard in Inveflo.
1) TL;DR
Falling RRP = liquidity thaw = buy signal. Rising RRP = liquidity freeze = sell signal. But don't just watch the absolute level — watch the velocity of change. A 10% drop in RRP over 4 weeks predicts 10%+ rallies in growth stocks. A 20% rise in RRP over 4 weeks predicts 15%+ drawdowns.
2) Hook (Pain-Driven)
In late 2022, RRP fell from $1.8T to $600B over eight weeks. I didn't notice because I was too focused on Fed rate hikes. By the time I saw the inflection, the market had already rallied 20%. I missed three months of alpha because I couldn't read the RRP signal. After that, I built a momentum indicator around RRP velocity — and it's been my most reliable macroeconomic timer ever since.
3) Problem
RRP is noisy. It bounces around daily. You can't trade a point-in-time number — you'll get whipsawed. What matters is the trend — the direction and speed of change over weeks. Most traders don't know how to extract signal from RRP noise.
4) Solution (Widget Introduction)
The Macro Liquidity Scan applies momentum analysis to RRP:
- RRP 4-Week Moving Average: Smooths out daily noise. Shows the true trend.
- RRP Momentum: Calculates the percentage change over 4 weeks. Positive = falling RRP (bullish). Negative = rising RRP (bearish).
- Momentum Threshold Alerts: Flashes green when RRP falls >10% over 4 weeks (buy setup). Flashes red when RRP rises >20% over 4 weeks (sell setup).
- Duration Tracking: A 2-week RRP decline is noise. A 6-week decline is signal.
5) Logic Breakdown (Formula + Thresholds)
- RRP Momentum < −10% (Strong Buy): Expected move +8% to +15% growth over 4-8 weeks. Rotate into QQQ, small-cap, leverage. Reduce bonds by 20%.
- RRP Momentum −5% to −10% (Weak Buy): Expected move +3% to +8%. Gradual rotation. Add to growth over 2 weeks.
- RRP Momentum −5% to +5% (Neutral): Hold. No strong signal. Stay defensive. ±2% whipsaw risk.
- RRP Momentum +5% to +20% (Weak Sell): Trim growth by 10%. Add bonds/gold. Expected −5% to −12% growth.
- RRP Momentum > +20% (Strong Sell): Full defensive: 70% bonds, 20% gold, 10% growth. Expected −10% to −20% growth.
6) Practical Use (IF X → THEN Y)
- If RRP declines from $1.2T to <$900B over 6 weeks (−25% momentum), then rotate 30% from bonds/TLT into QQQ/small-cap growth. Set a trailing stop at −8%. Hold 4–8 weeks until momentum reverts.
- If RRP rises from $800B to $1.3T over 4 weeks (+62% momentum), then move to 65% TLT/bonds, 25% gold, 10% defensive. Liquidate QQQ and leveraged positions.
- If RRP stable, momentum ±3% (yellow signal), then hold current allocation. Avoid new directional bets. Rebalance and take profits on winners.
7) Common Mistakes
- Trading Absolute Levels Instead of Momentum: A $1.5T RRP level doesn't mean "buy" or "sell." But a −15% momentum means "strong buy." Absolute levels are context-dependent; momentum is universal.
- Using Weekly Data Instead of 4-Week Averages: RRP bounces ±$100B–$200B weekly due to Treasury operations and quarter-end flows. A single week of RRP rising is meaningless. Always use 4-week rolling averages.
- Ignoring Duration: A −20% momentum that lasts 2 weeks is a fakeout. A −20% momentum that holds for 6 weeks is real. Always ask: how long has this momentum been in effect?
- Forgetting RRP Is Inverse to Liquidity: Falling RRP = looser liquidity = bullish. But check whether RRP is falling because banks are deploying capital, or because of forced liquidations.
Frequently Asked Questions
Can RRP momentum predict the exact stock market move?
No. RRP momentum predicts the direction and likelihood of a move, not the size or timing. A −15% momentum almost always leads to a 4–8% rally within 4–8 weeks. But it could be 3%, or it could be 12%. Use RRP as a filter, not a precision instrument.
What if RRP momentum flips mid-trade (e.g., from −15% to +10%)?
Close the trade. RRP momentum flips happen when the Fed changes policy suddenly, or when Treasury operations shift dramatically. If you bought on a −15% signal and momentum flips to +5%, that's a reversal signal. Take the profit or cut the loss, depending on your entry.
How does RRP momentum interact with Fed rate hikes?
Rate hikes increase the reverse-repo rate, making RRP more attractive. But this is mechanical. The true signal is whether RRP is rising because rates are attractive, or because banks have no place to deploy cash. Combine RRP momentum with yield curve steepness to distinguish.
Is RRP momentum better than traditional technical indicators (RSI, MACD)?
No — they're complementary. RRP momentum is a macroeconomic indicator with a 4–8 week lead time. RSI/MACD are technical indicators with a 1–3 day lead time. Use RRP for strategic allocation (growth vs. bonds), and use technical indicators for tactical entries (buy/sell individual stocks).
Related Posts
- #22 Reverse Repo and Net Liquidity: The Hidden Liquidity Variable Macro · Liquidity
- #24 Building a Risk Thermometer Based on Net Liquidity Macro · Risk
- #16 Macro Liquidity Scan Overview: Why Liquidity Drives Markets Macro · Liquidity
CTA: Open Macro & Flow Dashboard
Open the live liquidity and capital-flow widgets to turn this guide into a weekly portfolio decision process.