Macro · Tech
#51 How Fed Balance Sheet Signals Guide Tech Exposure
· 7 min read
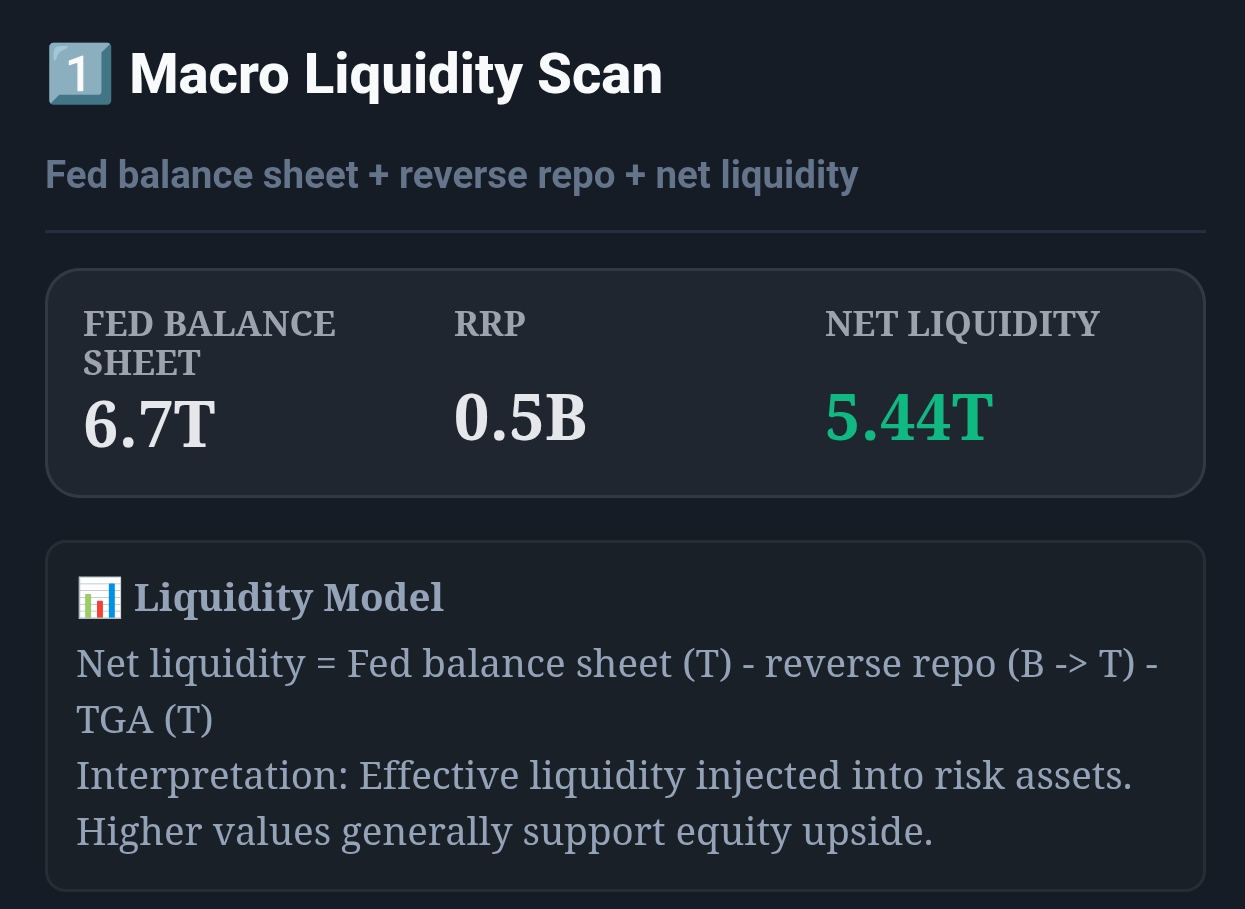
Tech allocation multiplier mapped to Fed Balance Sheet thresholds for regime-aware positioning.
📍 Home › ANALYSIS_2 › Widget 1: Macro Liquidity Scan
0) Where to Find This Widget
From the main dashboard (12 tiles), open ANALYSIS_2. In Widget 1: Macro Liquidity Scan, monitor the Fed Balance Sheet level and watch for key thresholds ($7.5T, $7.0T, $6.5T). Pair it with your QQQ and XLK exposure decisions.

Live capture of Dashboard in Inveflo.
1) TL;DR
Tech (QQQ, XLK) thrives in QE (Fed Balance >$7.5T) and struggles in QT (Fed Balance <$6.5T). Create a simple allocation multiplier: Green regime = 1.3-1.5x baseline, Yellow = 1.0x, Red = 0.5-0.6x. This removes emotion and ties your tech weight directly to the Fed's structural policy.
2) Hook (Pain-Driven)
I held QQQ at 30% of my portfolio through 2022's $1 trillion Fed Balance contraction. Lost 35% in QQQ vs. 18% in SPY — a 17% underperformance I could have avoided. If I'd simply reduced QQQ from 30% to 15% when Fed Balance crossed below $7.0T, I'd have cut losses by half.
3) Problem
Most portfolios hold a fixed tech weight regardless of Fed policy regime. They assume tech's long-term alpha dominates short-term structural headwinds. But in QT cycles, tech underperforms by 12-15% over 6 months while bonds rally. The question: Why hold max tech weight in a regime where it structurally underperforms?
4) Solution (Widget Introduction)
Open ANALYSIS_2 and check the Fed Balance Sheet level each week (Thursday, 4:30 PM ET). Map it to your tech multiplier: >$7.5T = 1.5x, $7.0-7.5T = 1.2x, $6.5-7.0T = 1.0x, <$6.5T = 0.6x. Rebalance gradually (over 2 weeks) when the threshold shifts. This removes daily noise and focuses on regime.
5) Logic Breakdown (Formula + Thresholds)
- Green Zone (>$7.5T): QQQ 1.5x baseline, XLK 1.2x baseline. Maximum QE effect; high-beta wins.
- Yellow Zone ($6.5-7.5T): QQQ 1.0x baseline, XLK 1.0x baseline. Neutral regime; equal weighting.
- Red Zone (<$6.5T): QQQ 0.5x baseline, XLK 0.7x baseline. QT headwind; underweight both, diversify to value.
- Transition Rule: If Fed Balance swings >$100B in a week (noise), hold allocation. Shift only on 3+ week sustained move.
6) Practical Use (IF X → THEN Y)
- If Fed Balance rises from $6.8T to $7.2T and stabilizes for 3 weeks, then increase QQQ from 20% to 25% and XLK from 12% to 14%.
- If Fed Balance drops from $7.1T to $6.4T over 4 weeks, then reduce QQQ from 25% to 12.5% and rebalance gains into bonds/value.
- If Fed Balance is at $7.5T+ but earnings forecasts are being cut >15%, then hold neutral 1.0x until earnings stabilize (don't chase on liquidity alone).
Should I use QQQ or XLK? Both. QQQ for growth tilt (higher beta), XLK for stability. Rebalance QQQ more aggressively (±0.5x), XLK moderately (±0.2x). What if I hold individual tech stocks instead of ETFs? Same logic applies—reduce concentration in QT; concentrate in QE. Can I use other metrics alongside Fed Balance? Yes—always check valuations (high P/E in Red = extra caution) and earnings trends.
7) Common Mistakes
- Over-reacting to a single week of Fed Balance noise (swings <$50B are normal; wait for 3-week trends before shifting).
- Going 0% tech in Red regime — this locks in losses and exposes you to rebound whipsaws. Keep 10-15% minimum for convexity.
- Holding max tech weight in Yellow zone thinking the regime is "still good" — Yellow is fence-sitting; reduce to baseline and stay flexible.
Tech is your bull asset; use Fed policy to time your overweights and underweights, not to abandon it.
Frequently Asked Questions
Should I ever go below 20% tech in a portfolio, even in Red regime?
Yes, in severe QT (Fed Balance <$6.0T, RRP >$2.5T sustained). Historical bear markets show tech underperformance of 40-50% when combined headwinds (QT + rate hikes + earnings cuts) persist. Minimum 10-15% tech serves as a hedge if the regime turns suddenly. Panic selling (0% tech) locks in losses; patience (10-15%) captures the rebound.
What if Fed Balance rises but earnings forecasts are being cut?
Liquidity (Fed Balance) is structural; earnings are fundamental. If Fed Balance is expanding (QE tailwind) but earnings decline >15%, hold neutral weight (1.0x) and look for valuation support first. Liquidity wins in rallies; earnings wins in corrections. When both deteriorate, reduce to underweight (0.6x) until earnings stabilize.
How quickly should I rebalance tech when Fed Balance crosses a threshold?
Gradual rebalancing over 2-3 weeks, not immediate. Tech is volatile; sudden swings in Fed Balance data (single-week variance) shouldn't trigger major tilts. If Fed Balance sustainably crosses a threshold (3+ consecutive weeks of new level), then rebalance over 10-15 trading days to avoid slippage. Use limit orders.
Should I apply the same multiplier to both QQQ and XLK?
No. QQQ (Nasdaq 100, high-beta growth) responds more aggressively to Fed Balance changes (±30% relative to baseline). XLK (Technology Select Sector, more defensive) responds moderately (±15-20% relative). In Green regime, overweight QQQ 1.5x, XLK 1.2x. In Red regime, underweight QQQ 0.5x, XLK 0.7x. Pair with individual stock selection for final positioning.
Related Posts
CTA: Open Macro & Flow Dashboard
Open the live liquidity and capital-flow widgets to turn this guide into a weekly portfolio decision process.