Macro · Allocation
#54 How to Build a Weekly Asset Allocation Routine With Liquidity
· 7 min read
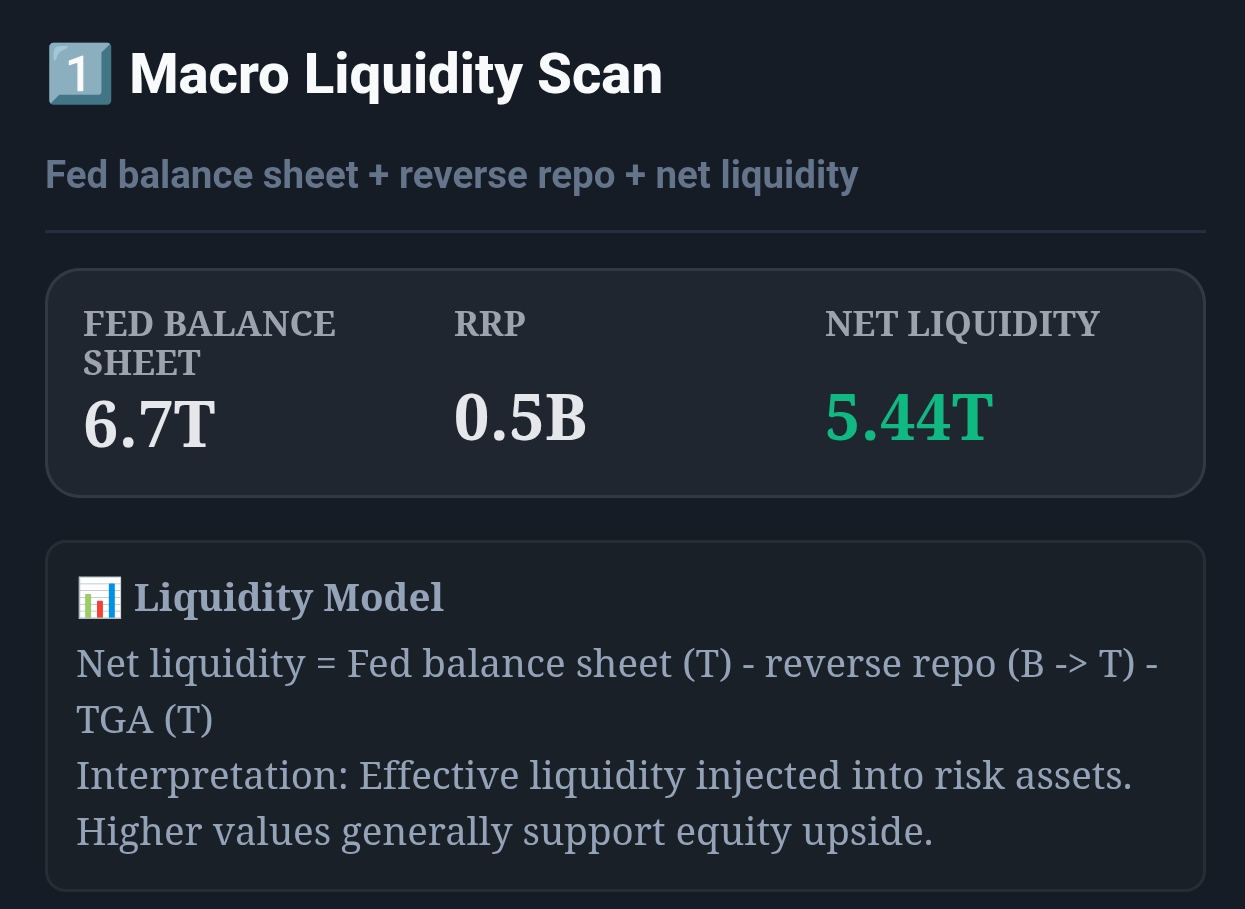
Live capture of Macro Liquidity Scan with allocation regime overlay in Inveflo.
📍 Home › ANALYSIS_2 › Widget 1: Macro Liquidity Scan
0) Where to Find This Widget
From the main dashboard (12 tiles), open ANALYSIS_2. Macro Liquidity Scan is Widget 1 at the top, showing Fed Balance, Reverse Repo, and Net Liquidity for your weekly allocation decisions.
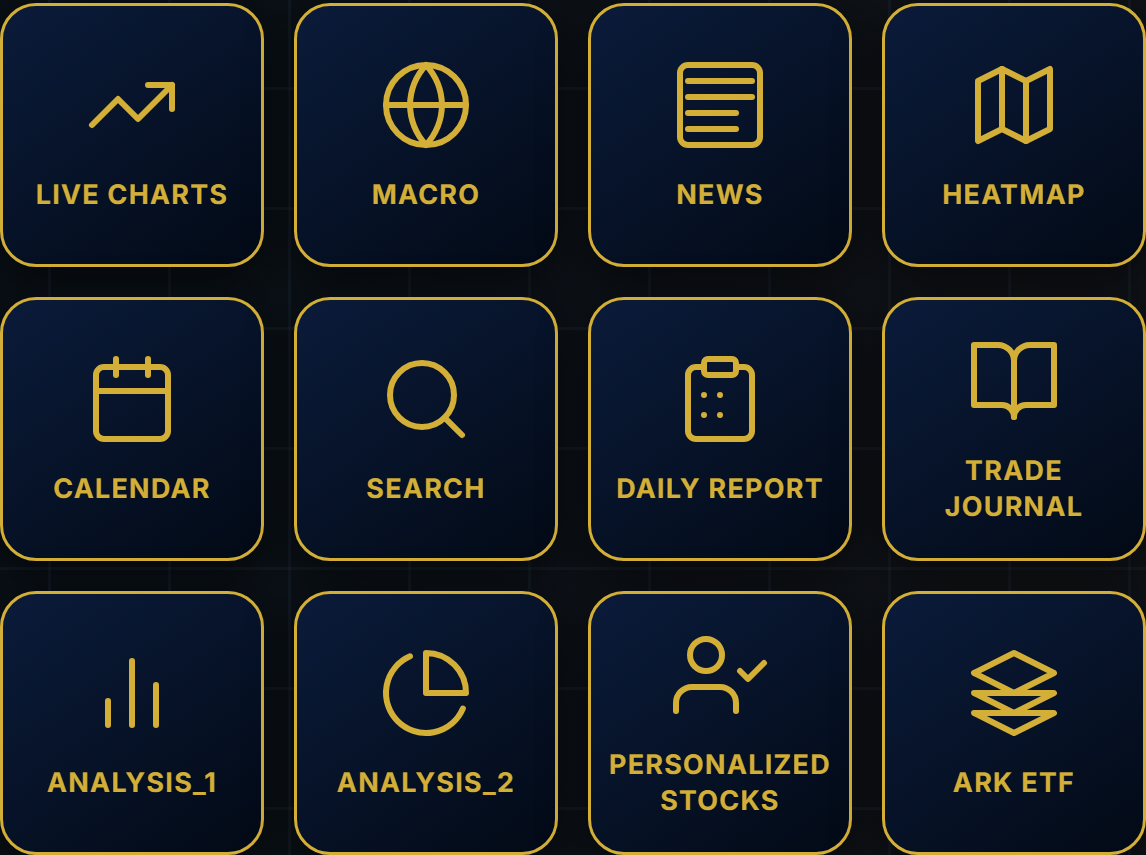
Live capture of Dashboard in Inveflo.
1) TL;DR
Every Sunday evening, check Macro Liquidity Scan and adjust your portfolio across 3 regime buckets. Green regime (LiquidityScore >70) = 70% growth, 10% defensive. Yellow (50–70) = 50/40/10 split. Red (<50) = 30% growth, 50% bonds, 20% cash. This one ritual prevents holding too much risk in policy headwinds and captures upside in loose conditions.
2) Hook (Pain-Driven)
I stayed 80% growth through the first 6 weeks of 2024 QT acceleration, lost 8%, and only then cut to 50% risk. If I'd checked the Macro Liquidity Scan on Sunday evenings, I would have seen the Red signal forming 3 weeks earlier. That's the cost of no regime rhythm: reactive losses instead of proactive tilts.
3) Problem
Most investors rebalance ad hoc—when they feel nervous or read the news—rather than on macro signals. This creates whipsaws and regret. You don't have a calendar trigger; you don't have thresholds for when to act. The question becomes: On what day, at what signal level, do I actually shift my portfolio?
4) Solution (Widget Introduction)
Open ANALYSIS_2 every Sunday at 6 PM ET. Check Widget 1: Macro Liquidity Scan and compare to last week. The regime color (Green/Yellow/Red) directly maps to your allocation template (70/20/10 → 50/40/10 → 30/50/20). Spend 5 minutes reviewing Fed Balance outflows and RRP changes; if trend is stable, hold allocation; if turning, rebalance by end of day.
5) Logic Breakdown (Formula + Thresholds)
- Green (>70): LiquidityScore >70, Fed Balance expanding, RRP <$1.8T → Growth 70% (QQQ, XLK), Value 20% (XLF, XLV), Bonds 10%
- Yellow (50–70): LiquidityScore 50–70, Fed neutral, RRP $1.8–2.2T → Growth 50% (SPY), Value 40% (XLV, dividend ETFs), Bonds 10%
- Red (<50): LiquidityScore <50, QT active, RRP >$2.2T → Growth 30% (inverse sector/hedges), Bonds 50% (TLT, HYG), Cash 20%
- Transition rules: Shift takes 1-2 weeks; do not reverse all at once. Green→Yellow: trim 15-20%. Yellow→Red: raise bonds by 25-30%.
6) Practical Use (IF X → THEN Y)
- If Liquidity Score turns Green after 3 weeks of Yellow, then add 15% to QQQ and reduce bond holdings from 40% → 25% over 5 trading days.
- If Fed Balance contracts >$90B in a single week (QT spike), then shift from current allocation to Yellow immediately (reduce growth by 20%).
- If LiquidityScore stays Red for 4+ weeks, then reduce growth to 25% and raise TLT/HYG to 55% — extend holding period into 3-6 month bonds.
Should I hold more cash in Red? Yes, 15-20% minimum. What if the Fed pivots mid-week? Watch for announcement; shift allocation by EOD if LiquidityScore jumps >15 points. Can I use sector weights instead of ETFs? Yes—same allocation, but pick 3-4 large-cap names per sector for lower fees.
7) Common Mistakes
- Treating one week of Green as a signal to go 90% growth — it takes 2-3 weeks of sustained Green + Fed Balance expansion to raise to 70%. Lock in the signal first.
- Selling everything into Red without holding bonds — you miss the rebound. Keep 25-30% equities (defensive) in Red so you don't chase after the recovery starts.
- Ignoring the lag between Fed policy change and market impact (4-12 weeks) — don't exit early on Yellow. Stay until Red confirms for 2+ weeks.
Discipline beats timing. A 70/20/10 allocation held consistently through 3 Green cycles beats panic-selling on noise.
Frequently Asked Questions
How often should I rebalance my portfolio based on liquidity signals?
Run your allocation review every Sunday evening (before market open Monday) using the previous week's Fed Balance Sheet, RRP, and Liquidity Score data. Major rebalancing happens on 50-point shifts in LiquidityScore (e.g., 65→50, 45→60) or when Fed policy formally changes. Minor adjustments (sector tilts) happen every 2-3 weeks if regime is stable.
What is the allocation split when Liquidity Score turns Green?
Green (LiquidityScore >70): 70% Growth + Tech (QQQ, XLK), 20% Risk-On Sectors (XLF, XLV), 10% Defensive. Reduce bonds (TLT) to 5-8%. Green signals QE or loose policy, favoring high-beta, rate-sensitive assets. Historical 85% of rallies >5% occurred under Green; pair with CSS >75 for highest confidence.
How do I handle the transition from Red to Yellow?
Red→Yellow is a de-risking window (2-4 week lag). Do not reverse all defensive moves immediately. Instead: (1) trim 30% of growth holdings over 2-3 weeks, (2) hold HYG/bonds until LiquidityScore clears 55-60, (3) monitor Fed Balance Sheet for stabilization (outflows <$60B/week). Rushing back into risk before confirmation triggers whipsaws.
Can I use Liquidity Score alone to guide allocation, or do I need other signals?
Liquidity Score is structural (Fed policy) and necessary but not sufficient. Always pair it with: (1) CSS >75 for tactical entries, (2) Momentum Breakout for short-term confirmation, (3) Credit Spread <350bp for low stress, (4) Yield Curve slope for recession risk. Liquidity sets regime; technical/sentiment confirms timing.
Related Posts
CTA: Open Macro & Flow Dashboard
Open the live liquidity and capital-flow widgets to turn this guide into a weekly portfolio decision process.