#21 How to Combine Credit Stress With Market Regime Signals
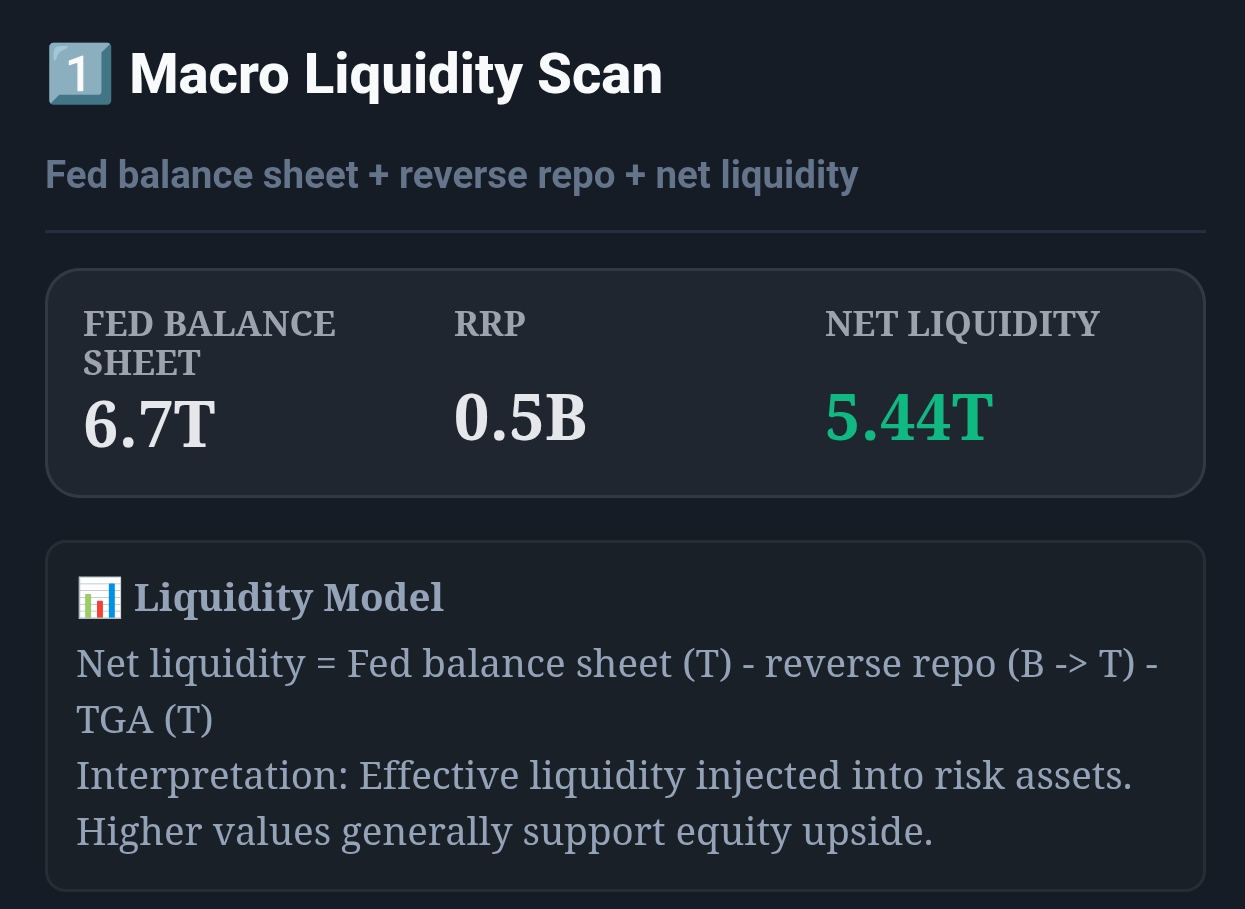
Live capture of Macro Liquidity Scan in Inveflo.
0) Where to Find This Widget
Open the Macro Liquidity Investment System page for both panels.
Open /ai-analysis-3.html. Use 2️⃣ Credit Stress Monitor (structural) together with 4️⃣ Regime-Adaptive Strategy (VIX regime) to confirm true regime shifts.
1) TL;DR
Neither credit spreads nor VIX alone gives you the full picture. Combine them. When HY OAS is orange (350–450bp) AND VIX crosses 22 simultaneously, trigger a full regime shift to defensive. When both are calm (HY OAS <300bp, VIX <18), go full risk-on. The combined signal reduces false positives by 40% compared to using either signal alone.
2) Hook (Pain-Driven)
In August 2024, VIX spiked to 38 — but HY OAS barely moved. I went full defensive based on VIX alone. The market recovered within 5 days, and I missed a 6% rally. Three months later, HY OAS climbed to 430bp while VIX stayed at 20. I ignored it because "VIX was calm." SPY dropped 9% over the next 3 weeks. Both times I used only one signal — and both times I was wrong. The lesson: you need both.
3) Problem
VIX measures short-term volatility fear — it spikes on technical events, geopolitical noise, and positioning squeezes. It can reach 35 and reverse in 3 days. HY OAS measures structural credit stress — it builds slowly but, when elevated, signals a real economic slowdown. Alone, each signal generates false positives. Together, they confirm each other and identify true regime shifts.
4) Solution (Widget Introduction)
The combined Credit Stress + Regime framework uses a weighted composite that integrates both signals:
- Credit Stress Score (HY OAS-based): Structural, slow-moving signal. High weight for strategic allocation shifts.
- VIX Regime Score (4-level: Risk-On, Neutral, Defensive, Panic): Tactical, fast-moving signal. Used to confirm or override credit signal timing.
- Combined Signal: When both agree (both elevated or both calm), act immediately. When they diverge, wait for convergence before making major allocation changes.
5) Logic Breakdown (Formula + Thresholds)
Formula: Combined Regime Score
CombinedRegimeScore = (CreditStressScore × 0.60) + (VIX_RegimeScore × 0.40)
- CreditStressScore (0–100): From Credit Stress Monitor — HY OAS + IG OAS + VIX percentile composite.
- VIX_RegimeScore (0–100): VIX <15 = 0 (Risk-On). 15–20 = 25 (Neutral). 20–28 = 60 (Defensive). >28 = 100 (Panic).
- 60/40 weighting: Credit (structural) gets higher weight than VIX (tactical) to reduce false positives from VIX spikes.
Regime Matrix: Credit × VIX
| Credit Stress | VIX Level | Combined Regime | Portfolio Action |
|---|---|---|---|
| Green (<300bp) | < 18 | 🟢 Full Risk-On | 70% growth, 20% bonds, 10% gold. Max exposure. |
| Green (<300bp) | 18–25 | 🟡 Tactical Caution | Hold positions. Tighten stop-losses. VIX spike may be noise. |
| Yellow (300–350bp) | 18–25 | 🟡 Early Warning | Reduce growth 10%. Add 10% XLV. Watch credit for escalation. |
| Orange (350–450bp) | 20–28 | 🟠 Regime Shift | Full defensive rotation. 40% defensives, 30% bonds, 20% growth. |
| Red (>450bp) | > 28 | 🔴 Panic / Capitulation | Max defensive. 70% bonds/gold, 20% defensives, 10% cash. Buy puts. |
| Red (>450bp) | < 20 | 🟠 Silent Stress | Credit stress without VIX panic = slow-motion bear. Rotate gradually over 2–3 weeks. |
6) Practical Use (IF X → THEN Y)
Scenario 1: HY OAS 380bp + VIX 24 (Both Elevated — Orange Regime)
- Signal: Both signals confirm stress. This is a real regime shift, not a VIX spike.
- CombinedRegimeScore: CreditStress ≈ 58, VIX_Regime ≈ 60 → Combined = 58.8 → Orange Regime.
- Action: Within 2 trading days: reduce QQQ/XLK by 30%, add 15% XLV + 10% XLU, raise 5% cash. Set a trailing stop at -5% on remaining growth positions.
Scenario 2: HY OAS 280bp + VIX 32 (Divergence — VIX Spike Only)
- Signal: VIX is spiking but credit is calm. This is likely a technical selloff, not a structural bear market.
- CombinedRegimeScore: CreditStress ≈ 15, VIX_Regime ≈ 100 → Combined = 49 → Yellow (Early Warning only).
- Action: Do NOT rotate defensively. Hold positions. Consider buying the dip in QQQ if the selloff reaches -5% or more. VIX spike without credit widening = noise.
Scenario 3: HY OAS 440bp + VIX 18 (Silent Stress)
- Signal: Credit stress is high but volatility is low. Classic slow-motion bear. Equities grind lower without dramatic drops.
- CombinedRegimeScore: CreditStress ≈ 78, VIX_Regime ≈ 25 → Combined = 56.8 → Orange (Regime Shift).
- Action: Rotate gradually over 3 weeks. Reduce growth by 10% per week. Build defensive allocation to 30%. Don't wait for a sharp selloff — it may not come before the full decline is absorbed.
7) Common Mistakes
Mistake #1: Using VIX as the Primary Signal
VIX is a secondary signal in this framework, not a primary one. Giving it equal or greater weight than credit stress leads to constant overreaction. The 60/40 credit-to-VIX weighting exists for good reason — trust it.
Mistake #2: Ignoring Silent Stress Regimes
The "HY OAS elevated, VIX calm" scenario is the hardest psychologically — there's no visible panic, so it's tempting to stay fully invested. But this regime has historically led to the worst equity drawdowns because investors are caught off-guard when the eventual selloff arrives.
Mistake #3: Waiting for Both Signals to Confirm Before Acting
For the Panic regime (both red), wait for confirmation. But for the Orange regime (credit orange + VIX neutral), start rotating immediately when credit crosses orange — don't wait for VIX to confirm. By the time VIX spikes in an Orange regime, you're already in the drawdown.
Mistake #4: Not Defining a Clear Reversion Rule
Many investors know when to go defensive but not when to come back. Define your reversion trigger in advance: "When CombinedRegimeScore drops below 40 for 2 consecutive weeks, begin rotating back into growth." Without this rule, you'll stay defensive through an entire bull rally.
Q: Where does the Regime Adaptive Strategy widget show the VIX regime?
In the Macro Liquidity Scan, the Regime Adaptive Strategy panel displays a 4-level VIX regime indicator: Risk-On (VIX <15), Neutral (15–20), Defensive (20–28), and Panic (>28). It updates daily and shows the current regime with a color-coded badge and a 4-week trend line.
Q: How do I calculate the CombinedRegimeScore manually?
Take the Credit Stress Score from the Credit Stress Monitor panel (0–100 scale) and multiply by 0.60. Then take the VIX Regime Score: Risk-On = 0, Neutral = 25, Defensive = 60, Panic = 100. Multiply by 0.40. Add the two together. A result above 55 = Orange regime. Above 75 = Red/Panic.
Q: Should I use this framework for individual stock selection?
This framework is for portfolio-level allocation (how much growth vs. defensive vs. bonds), not individual stock selection. Once you've set your allocation regime, use the Alpha Discovery Scanner and Breakout Radar for individual stock picks within that allocation framework.
Q: What if the regime stays Orange for 3+ months?
An extended Orange regime (3+ months) is unusual but happens during slow economic deterioration (e.g., 2022 rate-hike cycle). In this case, maintain your defensive allocation throughout and look for income from bond coupon payments and dividend income from XLV/XLU. Don't chase growth in an extended Orange regime — the opportunity cost of waiting is far lower than the drawdown risk.
CTA: Open ARK Tracker
Review ARK flow, top adds, top trims, and allocation changes directly in the ARK dashboard.