#20 How Credit Stress Signals Market Weakness Before Stocks Fall
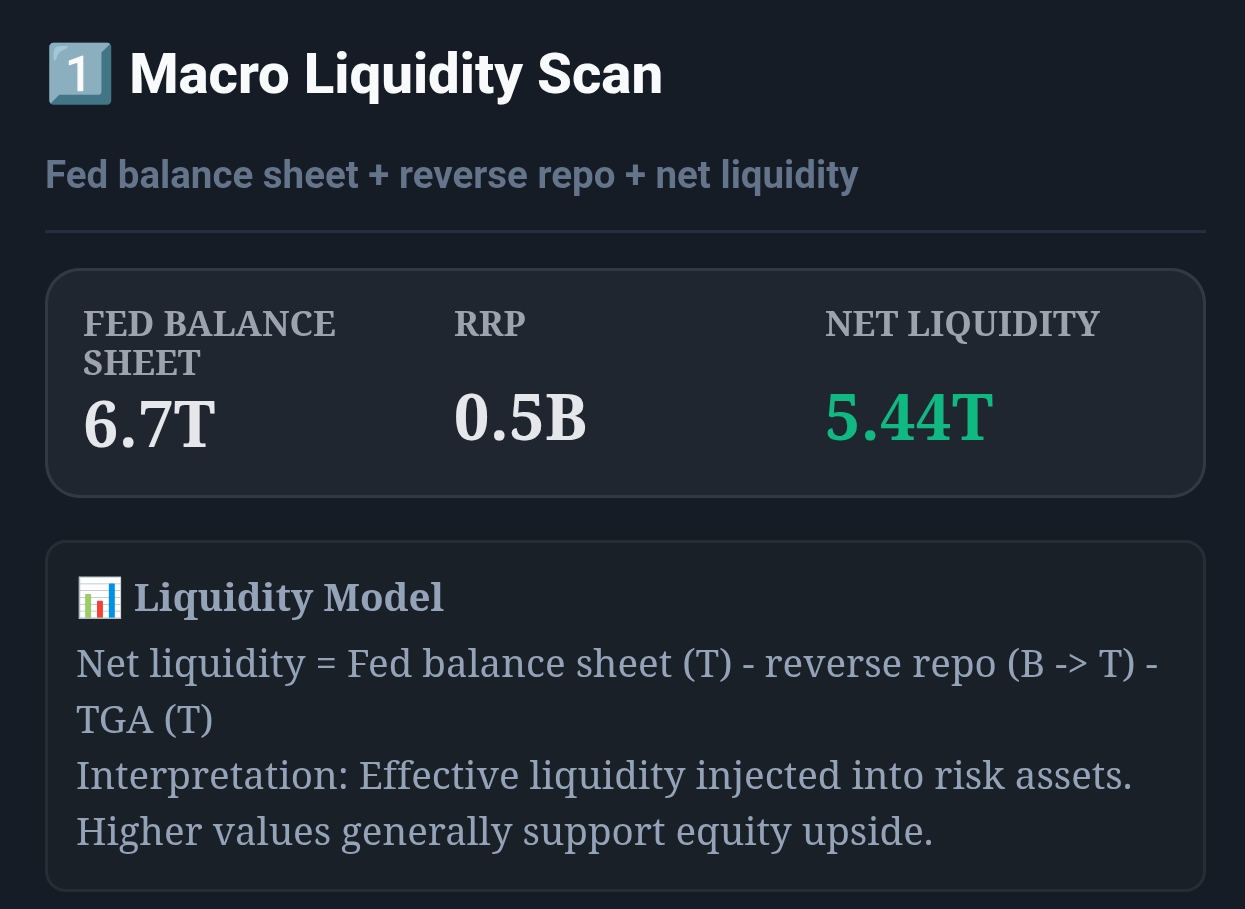
Live capture of Macro Liquidity Scan in Inveflo.
0) Where to Find This Widget
Open Macro Liquidity Investment System at /ai-analysis-3.html. In that page, find 2️⃣ Credit Stress Monitor — it displays HY OAS (High Yield spread), IG OAS (Investment Grade spread), and a composite credit stress signal with color-coded context.
1) TL;DR
Credit spreads widen 3–4 weeks before equities crash. When HY (High Yield) spread jumps >100 basis points in 2 weeks, reduce equity exposure by 30% and buy puts. A credit stress score > 70 (red) signals a capitulation setup where all assets will weaken. Watch HY OAS, IG OAS, and VIX together—they form the "canary in the coal mine" for systemic stress.
2) Hook (Pain-Driven)
In September 2023, I watched HY OAS widen from 340bp to 480bp over three weeks. I didn't act because I thought it was noise in one sector (regional banks). By week four, the S&P 500 had crashed 8%. By week six, it was down 12%. I left 8% on the table because I didn't understand: when credit spreads blow out, equities follow. Now I treat credit data as a leading indicator.
3) Problem
Most equity traders ignore the credit market. They focus on price action (RSI, moving averages) and miss the systemic signal: when credit is under stress, everything sells. Conversely, when credit is healing, even beaten-down equities rally hard. Credit spreads are a leading indicator of risk appetite across all assets.
4) Solution (Widget Introduction)
The Credit Stress Monitor tracks three metrics in real time:
- HY OAS (High Yield Option-Adjusted Spread): The extra yield investors demand to hold junk bonds (BBB− and below) instead of Treasuries. When companies are weak, HY spreads widen. When demand for risk is high, spreads compress.
- IG OAS (Investment Grade OAS): The spread for higher-quality bonds (BBB and above). Less volatile than HY, but a crucial confirmation signal.
- HY-IG Spread Differential: The gap between HY and IG spreads. A widening differential = stress is concentrated in weaker credits = systemic risk building.
- VIX Integration: Combines credit spreads with equity volatility to spot when equities are about to roll over.
The widget tracks these daily and flags when they exceed historical thresholds. A composite credit stress score (0–100) combines all signals. Red = crisis, Yellow = caution, Green = calm.
5) Logic Breakdown (Formula + Thresholds)
Formula: Credit Stress Score
CreditStressScore = (HY_OAS_pct × 0.40) + (IG_OAS_pct × 0.20) + (HY_IG_Diff_pct × 0.20) + (VIX_pct × 0.20)
Each component is a percentile rank (0–100) relative to the past 3 years:
- HY_OAS_pct: Percentile of current HY OAS vs. 3-year history. 0 = tightest spreads ever. 100 = widest spreads ever (crisis).
- IG_OAS_pct: Percentile of IG OAS. 0 = tightest. 100 = widest.
- HY_IG_Diff_pct: Percentile of the differential (HY − IG). When this widens, weak credits are getting pressured.
- VIX_pct: Percentile of VIX level. 0 = complacent. 100 = panicked.
Thresholds (Action Levels)
| Credit Stress Score | HY OAS Level | Signal | Action |
|---|---|---|---|
| 0–30 | < 300bp | 🟢 Calm (Green) | Risk-on. Equity allocation can be aggressive. No hedges needed. |
| 30–50 | 300–350bp | 🟡 Caution (Yellow) | Neutral. Monitor weekly. Start raising stop-losses on winners. |
| 50–70 | 350–450bp | 🟠 Stress (Orange) | Warning signal. Reduce equity by 15%. Buy 1-month OTM puts on SPY. |
| > 70 | > 450bp | 🔴 Crisis (Red) | Emergency. Reduce equity by 50%. 70% bonds, 20% gold, 10% equity. Full defensive. |
6) Practical Use (IF X → THEN Y)
Scenario 1: HY OAS Widens from 330bp to 450bp in 10 Days (Score 65 → 85)
- Signal: Acute stress in credit markets. This is a leading indicator of equity weakness.
- Expected Equity Move (2–4 weeks out): −8% to −15% on S&P 500. Small-cap and growth down 15–20%.
- Action: Immediate. Reduce equity exposure by 30–40%. Buy 1-month puts on QQQ (10% delta, max 5% of portfolio). Move cash to money market (4% yield). Keep stop-losses tight (2–3%) on remaining positions.
- Horizon: Hold hedge for 3–4 weeks. If HY OAS stays >420bp, the trade is still working. If it drops below 380bp, close the hedge (rally is coming).
Scenario 2: HY OAS at 480bp, Falling to 420bp over 2 Weeks (Score 85 → 70, reversing)
- Signal: Credit capitulation is healing. This is the strongest buy signal.
- Expected Equity Move (1–4 weeks out): +10% to +20% rally in equities. Growth stocks lead.
- Action: Close all hedges (puts). Rotate back into QQQ and small-cap growth. Add new positions. This is the inflection point for a sustained rally.
- Horizon: Ride the rally until HY OAS rises above 400bp again (warning signal) or credit stress score rises above 50 (rebalance).
Scenario 3: HY OAS Stable at 360bp, IG Widens Suddenly from 90bp to 140bp in 1 Week
- Signal: Unexpected systemic stress (banking crisis, geopolitical shock). Even quality credits are being sold.
- Expected Equity Move: Sharp −5% to −10% immediate drop. Followed by −10% to −20% over 2–4 weeks.
- Action: More aggressive than HY widening alone. Reduce equity by 50% immediately. Buy 6-month puts on SPY (protective). Build cash/bond position for buying the dip.
- Horizon: This is a 2–3 month bear market signal. Wait for IG OAS to stabilize and start compressing before rotating back.
7) Common Mistakes
Mistake #1: Ignoring IG OAS and Focusing Only on HY OAS
HY OAS can widen for 2–3 weeks and then stabilize—it's a sector-specific rotation. But if IG widens in tandem, that's systemic. Always check both before acting.
Mistake #2: Treating One-Day Spikes as Signals
Credit spreads can spike 50bp in a single day due to supply (new bond issuance), month-end flows, or technical positioning. Look for spreads that hold elevated for 3+ days before treating it as a real signal.
Mistake #3: Using Credit Spreads for Daily Trading
Credit data is a strategic signal, not a tactical one. Use it to set your risk allocation (aggressive, balanced, defensive), not to trade in-and-out daily. Combine credit spreads with technical indicators for entries.
Mistake #4: Forgetting That Credit Compression Predicts Rallies
The best buying opportunity is when HY OAS is >450bp and starting to fall. But many traders wait for it to compress all the way to 300bp—and miss half the rally. Start scaling in when HY falls through 420bp.
Q: How do credit spreads differ from credit default swaps (CDS)?
Credit spreads (OAS) are the difference in yield between a corporate bond and a risk-free Treasury. CDS are insurance contracts that pay out if the borrower defaults. OAS is forward-looking (market pricing in future risk); CDS is backward-looking (current default probability). For macro risk detection, OAS spreads are more relevant because they're driven by supply/demand for risk appetite.
Q: Can credit spreads help predict individual stock crashes?
Not directly. Credit spreads predict systemic stress across all equities. Individual stocks can crash for idiosyncratic reasons (missed earnings, fraud, CEO departure) without moving credit spreads. Use credit spreads to manage your portfolio-level risk, then use company-specific analysis for individual stock picks.
Q: What if HY OAS widens but VIX stays flat?
This happens when credit stress is concentrated in a specific sector (e.g., regional banks) or when selling is orderly (not panicked). In this case, equities can hold up for 1–2 more weeks before rolling over. But treat it as a yellow flag—the widening is real, and a general equity decline is likely coming. Don't be complacent.
Q: How often should I check credit spreads?
Daily during periods of elevated stress (credit stress score > 50), weekly during calm periods. Set automatic alerts when HY OAS rises above 400bp or falls below 300bp—these are the inflection points that matter for your portfolio.
CTA: Open ARK Tracker
Review ARK flow, top adds, top trims, and allocation changes directly in the ARK dashboard.