#37 How to Reduce Losses in Overheated Momentum Stocks
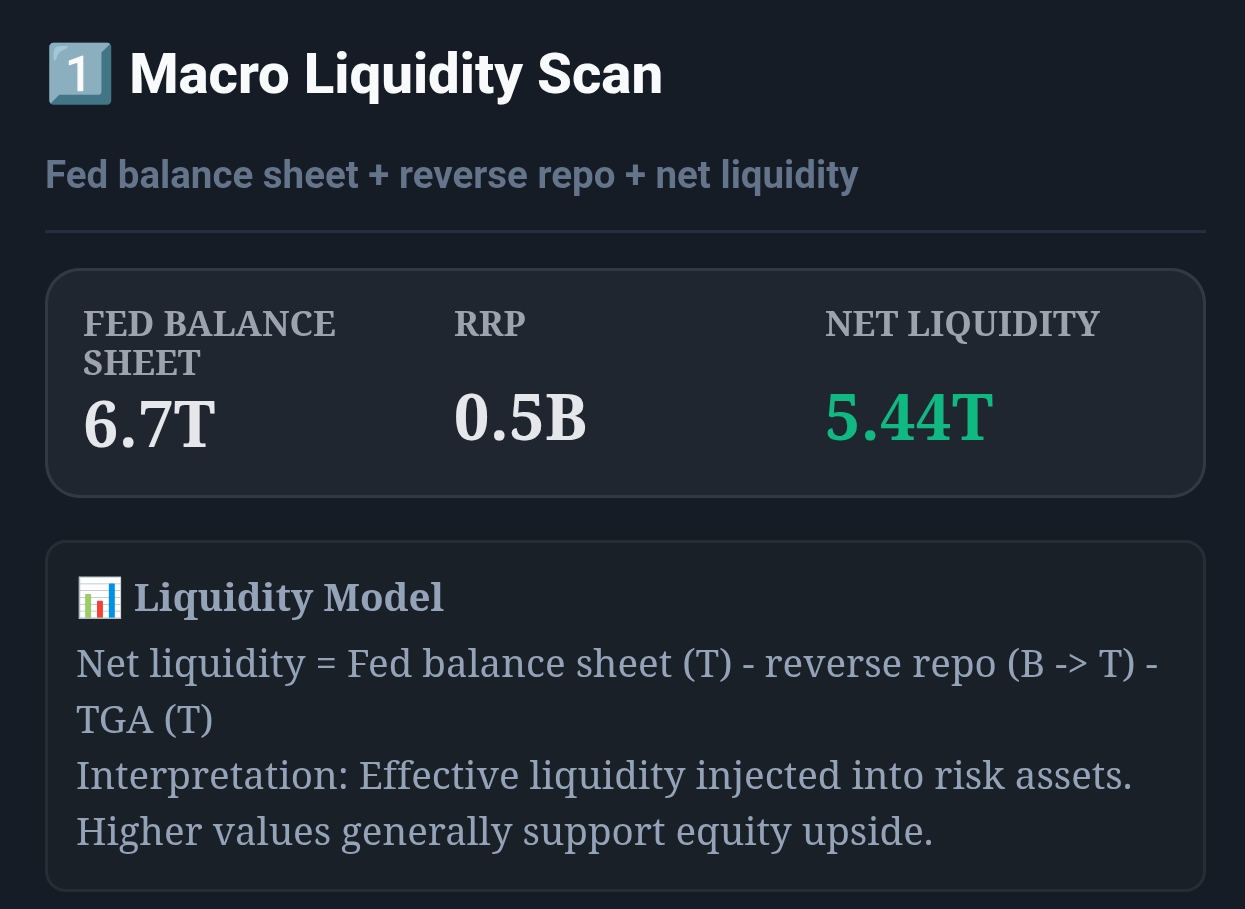
Live capture of Macro Liquidity Scan in Inveflo.
0) Where to Find This Widget

Open the Macro Liquidity Investment System page for Momentum Overheat.
Open /ai-analysis-3.html and find 3️⃣ Momentum Breakout. Use its overheat-style warnings (score extremes / fast score acceleration) to manage trims and stops before reversals.
1) TL;DR
Momentum stocks overheat when they run too far, too fast — creating a violent reversal setup. Detect overheat using the OverheatScore (MomentumScore deviation above its 4-week average). When OverheatScore >30, trim 30% of position. When >50, trim 50%. Overheated moves don't always reverse immediately, but your risk/reward is so poor at extreme readings that trimming is almost always correct.
2) Hook (Pain-Driven)
In early 2024 I held a semiconductor stock up 45% in 6 weeks. The MomentumScore was 94 — the highest I'd ever seen. Instead of trimming, I held for more. "It's working," I told myself. Over the next 4 days the stock fell 22% with no news. I gave back 12% of my 45% gain in less than a week. The OverheatScore had been flashing above 55 for 3 consecutive days before the reversal. It was telling me exactly what was about to happen. I just didn't have a rule for it.
3) Problem
Overheated momentum stocks have excellent past performance (that's why they're overheated) but terrible forward risk/reward. The more extended a stock becomes, the larger the eventual reversion. Typical overheat characteristics: RSI above 80, price 20%+ above the 50-day MA, volume declining while price extends, institutional profit-taking beginning. The problem: these stocks feel the most "safe" right before they reverse violently.
4) Solution (Widget Introduction)
The OverheatScore measures how far a stock's current MomentumScore diverges above its 4-week rolling average. It answers: "Is this stock moving faster than its recent normal?" High deviation = overheat. The score uses three inputs:
- MomentumScore Deviation: Current MomentumScore minus 4-week average MomentumScore. The primary overheat signal.
- Price Extension: How far price has moved above the 20-day moving average, expressed as a percentage. >15% = extended.
- Volume Divergence: Whether volume is declining while price is still rising. Declining volume on rising price = distribution (institutions quietly selling into retail momentum).
5) Logic Breakdown (Formula + Thresholds)
Formula: OverheatScore
OverheatScore = (MomScore_deviation × 0.50) + (PriceExtension_pct × 0.30) + (VolumeDiv_pct × 0.20)
- MomScore_deviation: (Current MomentumScore − 4wk avg MomentumScore). Normalized to 0–100. Deviation >20 points = above 50 on this component.
- PriceExtension_pct: Percentile of (price / 20d MA − 1). Extension >15% = above 80th percentile.
- VolumeDiv_pct: Percentile of volume divergence (volume declining while price rising). High divergence = high distribution pressure.
Thresholds: Trim Rules by OverheatScore
| OverheatScore | Overheat Level | Reversal Risk | Action |
|---|---|---|---|
| 0–20 | 🟢 Normal | Low — trend is sustainable | Hold full position. No action needed. |
| 20–35 | 🟡 Warm | Moderate — beginning to extend | Tighten trailing stop to -10% (from -15%). No trimming yet. |
| 35–55 | 🟠 Hot | High — reversal setup forming | Trim 30% of position. Keep trailing stop at -10% on remainder. |
| > 55 | 🔴 Extreme Overheat | Very high — violent reversal imminent | Trim 50% immediately. Consider full exit if macro also Orange/Red. |
6) Practical Use (IF X → THEN Y)
Scenario 1: MomentumScore 92 (up from 4wk avg of 68), OverheatScore = 48
- Signal: Hot overheat. Score has blown past its recent average. Volume declining while price extends 18% above 20d MA.
- Action: Trim 30% of position at market close today. Tighten trailing stop on remaining 70% to -10% from the highest close.
- Monitor: If OverheatScore rises above 55 tomorrow, trim another 20% (now holding only 50% of original position).
Scenario 2: OverheatScore 62, CombinedRegimeScore Crosses Orange Same Day
- Signal: Dual signal — extreme overheat + macro deterioration. Highest-confidence sell setup.
- Action: Exit full position at market open tomorrow. No partial trim — this dual signal has historically preceded -20% to -35% drawdowns in momentum stocks within 4 weeks.
- Re-entry plan: Set a watchlist alert. Re-evaluate when OverheatScore normalizes below 20 AND macro returns to Yellow/Green.
Scenario 3: Trimmed 30% at OverheatScore 40, Stock Pulls Back 8% to Reset
- Signal: Healthy consolidation after overheat. OverheatScore normalized back to 15. MomentumScore still 72.
- Action: Add back the trimmed 30% on this pullback. You're re-entering at a better price with confirmed momentum and no overheat reading. This is the ideal trim-and-reload cycle.
7) Common Mistakes
Mistake #1: Holding Through Overheat "Because It's Working"
The best-performing momentum stocks feel the safest at peak overheat — precisely because they've gone up so much. This psychological trap is the leading cause of momentum crashes. The OverheatScore exists specifically to override this bias with data.
Mistake #2: Exiting Fully at First Overheat Reading
OverheatScore of 25–35 is "warm" — not a full exit trigger. These readings are common in strong momentum moves and often resolve via sideways consolidation without a sharp reversal. Save aggressive trimming for scores above 40. Full exits for scores above 55 + macro shift.
Mistake #3: Ignoring Volume Divergence
Price extension alone (stock up 20% above 20d MA) is not sufficient for trimming. But price extension combined with declining volume is a very different signal — it means buyers are exhausted and distribution is happening. Always check volume trend before acting on overheat readings.
Mistake #4: No Re-Entry Plan After Trimming
Trimming at overheat is the right move — but without a pre-defined re-entry plan, you'll either miss the next leg up entirely or chase back in at a worse price when FOMO kicks in. Define your re-entry conditions before you trim. Systematic re-entry prevents emotional re-entry.
Q: How is OverheatScore different from RSI?
RSI measures price momentum relative to recent price changes — it's a pure price signal. OverheatScore combines price extension, momentum score deviation, AND volume divergence. RSI at 80 tells you "the stock has been going up a lot." OverheatScore at 55 tells you "the stock is moving well above its recent momentum average AND volume is declining AND price is extended — distribution is likely beginning." Richer signal, more specific trim trigger.
Q: What if OverheatScore stays above 55 for 2 weeks without a reversal?
Rare but possible in strong institutional accumulation phases (e.g., index rebalancing, ETF inclusion events). If OverheatScore stays above 55 for more than 10 trading days and price continues making new highs with no volume divergence, consider that the "overheat" is being sustained by structural buying. In this case, hold the trimmed position and watch for the first sign of volume divergence before trimming further.
Q: Should I set price alerts for the OverheatScore thresholds?
Yes — set daily end-of-day alerts at OverheatScore = 35 (tighten stop) and OverheatScore = 55 (trim aggressively). The Macro Liquidity Scan updates scores after market close. Check your alerts each evening as part of your end-of-day routine. Catching an OverheatScore crossing 55 within 1–2 trading days of the signal gives you the best exit prices before the reversal accelerates.
Q: Can OverheatScore be used for sector ETF positions?
Yes, but the thresholds shift slightly. Sector ETFs have lower volatility than individual stocks, so an OverheatScore of 45 in an ETF is equivalent to about 55–60 in an individual stock. Adjust the trim triggers down by 10 points when applying this framework to XLK, QQQ, or other sector ETFs.
CTA: Open Macro Liquidity System
Use the live macro, credit, regime, and momentum widgets to validate the rules from this guide.