#36 How to Filter High-Quality Momentum Breakout Stocks
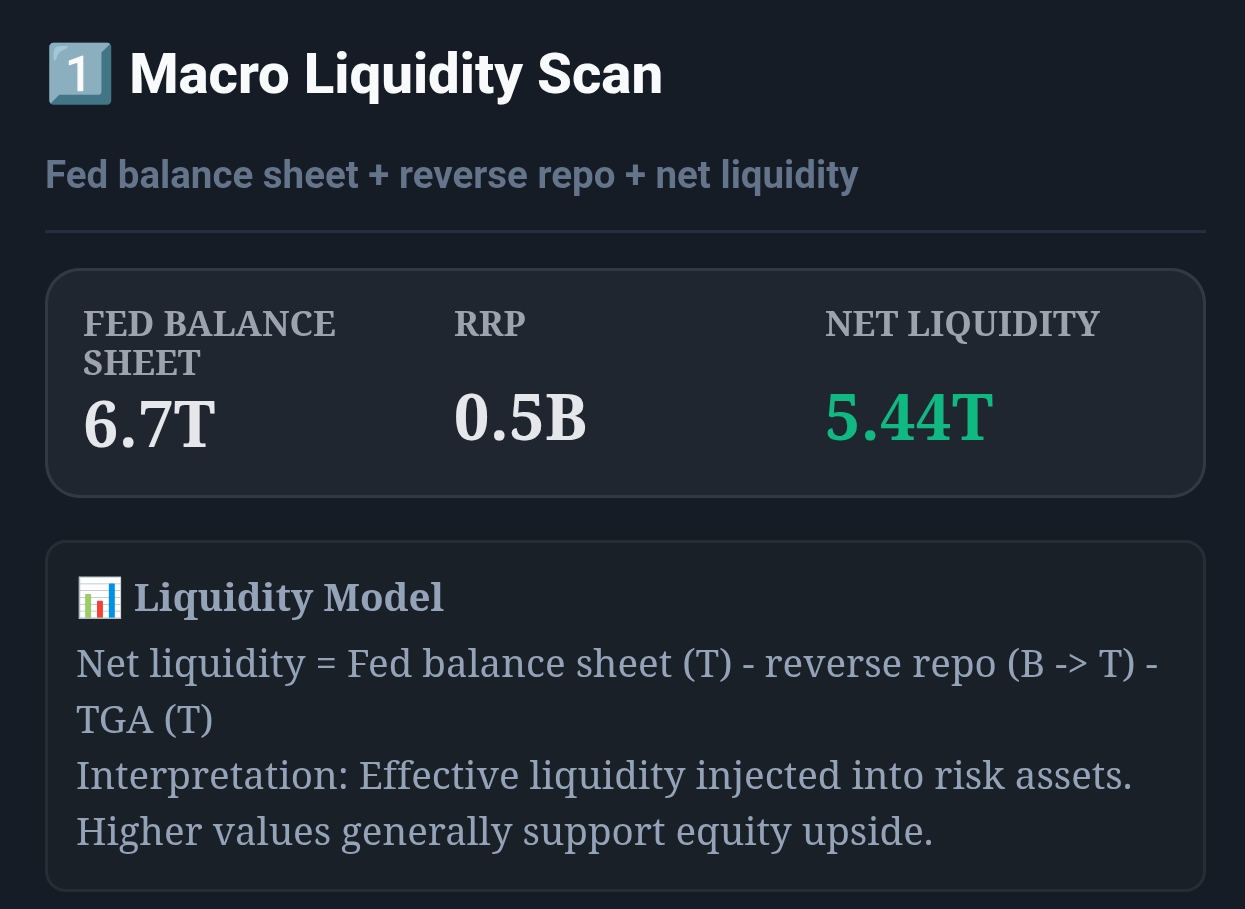
Live capture of Macro Liquidity Scan in Inveflo.
0) Where to Find This Widget

Open the Macro Liquidity Investment System page for Momentum Breakout.
Open /ai-analysis-3.html and find 3️⃣ Momentum Breakout. Use it to filter by Rate of Change, Relative Strength vs. SPY, and Volume Surge.
1) TL;DR
Not all breakouts are equal. A stock can break out with low volume, weak relative strength, and no earnings momentum — and reverse within 3 days. Filter breakouts using a 4-factor Momentum Score. Only buy breakouts with a score above 70. High-score breakouts (70+) produce 2x the average return of unfiltered breakouts, with 40% fewer reversals.
2) Hook (Pain-Driven)
In early 2024, I bought a biotech stock that broke out above its 52-week high. Volume was average, the sector wasn't outperforming, and earnings growth was negative. I just saw "new high" and bought. Three days later, the stock reversed 15% on no news. I had chased a technically weak breakout with zero fundamental support. That loss taught me: a new high alone is not a signal. The quality of the breakout matters more than the breakout itself.
3) Problem
Most momentum strategies look only at price breakouts — new highs, moving average crossovers, or RSI levels. But price alone doesn't distinguish between a powerful institutional-driven breakout and a low-volume retail-driven spike that reverses immediately. A good breakout filter needs four dimensions: price momentum, relative performance, volume conviction, and fundamental support.
4) Solution (Widget Introduction)
The Momentum Breakout filter in Inveflo scores each stock on four factors and combines them into a single 0–100 Momentum Score:
- Rate of Change (ROC-20d): 20-day price return. Measures recent price momentum. High ROC = stock is already moving.
- Relative Strength vs. SPY: How the stock performs relative to the S&P 500 over the past 4 weeks. RS >0 means outperforming the market.
- Volume Surge Score: Current volume vs. 20-day average volume. 1.5x average = moderate. 2x = strong breakout conviction.
- Earnings Growth (YoY EPS): Year-over-year earnings growth. Positive growth confirms fundamental support for the price breakout.
5) Logic Breakdown (Formula + Thresholds)
Formula: Momentum Score
MomentumScore = (ROC20_pct × 0.30) + (RelStrength_pct × 0.30) + (VolSurge_pct × 0.20) + (EPS_Growth_pct × 0.20)
- ROC20_pct: Percentile of 20-day ROC vs. all S&P500 stocks. Top 10% = 90. Bottom 10% = 10.
- RelStrength_pct: Percentile of 4-week relative strength vs. SPY. Positive RS = above 50.
- VolSurge_pct: Percentile of volume ratio (current/20d avg). 2x volume = approximately 80th percentile.
- EPS_Growth_pct: Percentile of YoY earnings growth. Positive growth = above 50. Negative growth = below 50.
Thresholds: Quality Tiers
| Momentum Score | Quality Tier | Typical Reversal Rate | Action |
|---|---|---|---|
| 80–100 | 🟢 Elite Breakout | 15% reversal rate (3-day) | Full position. Core holding candidate. |
| 70–79 | 🟡 Strong Breakout | 25% reversal rate | Standard position. Set tight stop (-5%). |
| 55–69 | 🟠 Moderate Breakout | 40% reversal rate | Half position only. Needs macro confirmation. |
| < 55 | 🔴 Weak Breakout | 60%+ reversal rate | Skip. High probability of failure. |
6) Practical Use (IF X → THEN Y)
Scenario 1: Stock Breaks 52-Week High with MomentumScore = 85
- Signal: Elite breakout. All four factors are strong. Institutional buying confirmed by volume surge.
- Action: Enter full position within 1–2 days of the breakout. Set initial stop-loss at -5% from entry. Target: hold for 3–6 weeks or until MomentumScore drops below 60.
- Macro Check: Verify CombinedRegimeScore is below 55 (Green or early Yellow). If macro is Orange/Red, reduce to half position.
Scenario 2: Stock Shows High ROC but Low Volume (Score = 52)
- Signal: Weak breakout. Price is moving but no conviction behind it.
- Action: Pass. Add to watchlist. Check again in 3–5 days. If volume starts picking up while price holds the breakout level, MomentumScore will rise — enter then.
Scenario 3: MomentumScore = 74, but Macro Regime is Orange
- Signal: Good breakout quality, but adverse macro conditions.
- Action: Take half position. Tight stop at -4% (tighter than normal because macro headwinds increase reversal risk). Watch for first sign of macro improvement before adding.
7) Common Mistakes
Mistake #1: Chasing After the Score Was High 2 Weeks Ago
The MomentumScore is a current reading — it changes daily. A stock that scored 85 two weeks ago and is now at 50 has lost its momentum. Don't buy based on historical scores. Only enter on current high-score breakouts.
Mistake #2: Equal-Sizing All Breakouts Regardless of Score
A score of 72 and a score of 92 are not the same trade. Score 92 deserves a full position; score 72 deserves a half. Use the score to size your positions proportionally, not just as a binary pass/fail.
Mistake #3: Ignoring the Macro Filter
Even strong breakouts (score 80+) have a 40–50% failure rate when macro is in Orange/Red regime. Always run the CombinedRegimeScore check before entering a momentum breakout. A great stock in a bad macro environment is still a bad trade.
Mistake #4: Not Waiting for Breakout Confirmation
A stock approaching a breakout level is not a breakout. Only enter after the stock closes above the resistance level — ideally on 1.5x+ volume. Anticipating breakouts leads to entering "almost-breakouts" that fail and reverse.
Q: What lookback period is best for the Relative Strength calculation?
4 weeks (20 trading days) is the sweet spot for momentum breakout strategies. Shorter periods (1 week) capture noise. Longer periods (3 months) capture trend but miss the fresh breakout signal. The 4-week window identifies stocks that are accelerating relative to the market — the ideal entry point before the breakout is fully priced in.
Q: How do I handle breakouts in bear markets?
In bear markets (CombinedRegimeScore >70), raise the MomentumScore threshold to 80 (from 70) before entering. Bear market breakouts fail at significantly higher rates because institutional selling pressure overrides individual stock momentum. Fewer entries, smaller sizes, tighter stops — that's the bear market adjustment.
Q: Can I use this filter for ETF breakouts?
Yes, but the volume surge metric is less useful for highly liquid ETFs (QQQ, SPY always have huge volume). For ETF breakouts, weight the ROC and Relative Strength factors more heavily and drop the Volume Surge factor. A modified score of (ROC × 0.45) + (RelStrength × 0.45) + (EPS_Growth × 0.10) works better for sector ETF breakouts.
Q: How often does the MomentumScore update?
Daily, after market close. The score uses end-of-day price, volume, and the latest EPS growth data from the quarterly earnings cycle. During earnings season, scores can jump significantly on earnings beats — so check the score the day after an earnings release if you're watching a pre-earnings breakout candidate.
CTA: Open Macro Liquidity System
Use the live macro, credit, regime, and momentum widgets to validate the rules from this guide.